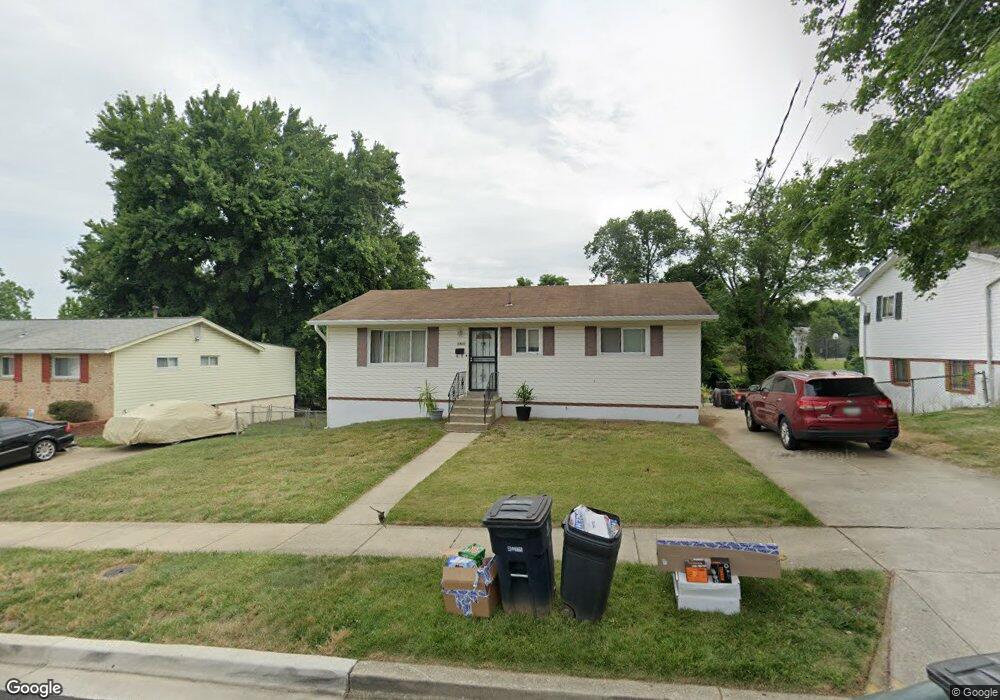
6906 Drylog St Capitol Heights, MD 20743
Estimated Value: $294,000 - $360,000
3
Beds
2
Baths
1,020
Sq Ft
$316/Sq Ft
Est. Value
About This Home
This home is located at 6906 Drylog St, Capitol Heights, MD 20743 and is currently estimated at $321,978, approximately $315 per square foot. 6906 Drylog St is a home located in Prince George's County with nearby schools including Carmody Hills Elementary School, G. James Gholson Middle School, and Central High School.
Ownership History
Date
Name
Owned For
Owner Type
Purchase Details
Closed on
Oct 1, 2008
Sold by
Gunn Francis M
Bought by
Washington Devita M
Current Estimated Value
Home Financials for this Owner
Home Financials are based on the most recent Mortgage that was taken out on this home.
Original Mortgage
$223,718
Outstanding Balance
$148,946
Interest Rate
6.54%
Mortgage Type
FHA
Estimated Equity
$173,032
Purchase Details
Closed on
Sep 18, 2008
Sold by
Gunn Francis M
Bought by
Washington Devita M
Home Financials for this Owner
Home Financials are based on the most recent Mortgage that was taken out on this home.
Original Mortgage
$223,718
Outstanding Balance
$148,946
Interest Rate
6.54%
Mortgage Type
FHA
Estimated Equity
$173,032
Purchase Details
Closed on
Jan 3, 1991
Sold by
Wilson Howard E
Bought by
Gunn Francis M and Gunn Currie C
Create a Home Valuation Report for This Property
The Home Valuation Report is an in-depth analysis detailing your home's value as well as a comparison with similar homes in the area
Home Values in the Area
Average Home Value in this Area
Purchase History
| Date | Buyer | Sale Price | Title Company |
|---|---|---|---|
| Washington Devita M | $229,000 | -- | |
| Washington Devita M | $229,000 | -- | |
| Gunn Francis M | $108,000 | -- |
Source: Public Records
Mortgage History
| Date | Status | Borrower | Loan Amount |
|---|---|---|---|
| Open | Washington Devita M | $223,718 | |
| Closed | Washington Devita M | $223,718 |
Source: Public Records
Tax History
| Year | Tax Paid | Tax Assessment Tax Assessment Total Assessment is a certain percentage of the fair market value that is determined by local assessors to be the total taxable value of land and additions on the property. | Land | Improvement |
|---|---|---|---|---|
| 2025 | $3,553 | $275,867 | -- | -- |
| 2024 | $3,553 | $267,933 | -- | -- |
| 2023 | $3,460 | $260,000 | $61,200 | $198,800 |
| 2022 | $3,275 | $239,633 | $0 | $0 |
| 2021 | $3,093 | $219,267 | $0 | $0 |
| 2020 | $2,980 | $198,900 | $45,600 | $153,300 |
| 2019 | $2,917 | $192,600 | $0 | $0 |
| 2018 | $2,841 | $186,300 | $0 | $0 |
| 2017 | $2,780 | $180,000 | $0 | $0 |
| 2016 | -- | $168,767 | $0 | $0 |
| 2015 | $3,748 | $157,533 | $0 | $0 |
| 2014 | $3,748 | $146,300 | $0 | $0 |
Source: Public Records
Map
Nearby Homes
- 725 Paldao Terrace
- 600 Goldleaf Ave
- 611 Fernleaf Ave
- 6615 Valley Park Rd
- 7303 Hastings Dr
- 970 Central Hills Ln
- 803 Booker Dr
- 6509 Seat Pleasant Dr
- 6512 Seat Pleasant Dr
- 6420 Valley Park Rd
- 510 Dateleaf Ave
- 6415 Valley Park Rd
- 7410 Crane Place
- 6703 Central Hills Terrace
- 6610 Arlene Dr
- 304 Cedarleaf Ave
- 418 Cedarleaf Ave
- 405 Birchleaf Ave
- 1016 Hill Rd
- 7513 Arcade Ct
- 6904 Drylog St
- 6910 Drylog St
- 6902 Drylog St
- 6901 Opal Place
- 6905 Drylog St
- 6907 Drylog St
- 6903 Drylog St
- 6816 Drylog St
- 6915 Malachite Place
- 6917 Malachite Place
- 6913 Malachite Place
- 6919 Malachite Place
- 6900 Opal Place
- 6909 Drylog St
- 6921 Malachite Place
- 6923 Malachite Place
- 6902 Opal Place
- 6914 Drylog St
- 6901 Drylog St
- 6904 Opal Place
Your Personal Tour Guide
Ask me questions while you tour the home.