6907 N Frankfort Rd Thorntown, IN 46071
Estimated Value: $469,000 - $600,000
4
Beds
3
Baths
3,471
Sq Ft
$156/Sq Ft
Est. Value
About This Home
This home is located at 6907 N Frankfort Rd, Thorntown, IN 46071 and is currently estimated at $541,635, approximately $156 per square foot. 6907 N Frankfort Rd is a home located in Boone County with nearby schools including Western Boone Junior/Senior High School.
Ownership History
Date
Name
Owned For
Owner Type
Purchase Details
Closed on
Jul 12, 2019
Sold by
Neal Mark W and Neal Aimee R
Bought by
Neal Mark W and Neal Aimee R
Current Estimated Value
Home Financials for this Owner
Home Financials are based on the most recent Mortgage that was taken out on this home.
Original Mortgage
$194,250
Outstanding Balance
$169,815
Interest Rate
3.82%
Mortgage Type
New Conventional
Estimated Equity
$371,820
Purchase Details
Closed on
Apr 30, 2009
Sold by
Neal Mark W
Bought by
Neal Mark W and Yoder Almee R
Purchase Details
Closed on
May 30, 2008
Sold by
Finley Mark R and Finley Barbara L
Bought by
Neal Mark W
Home Financials for this Owner
Home Financials are based on the most recent Mortgage that was taken out on this home.
Original Mortgage
$168,750
Interest Rate
6.09%
Mortgage Type
New Conventional
Purchase Details
Closed on
Feb 4, 2005
Sold by
Pike D Jason D and Pike Jill A
Bought by
Finley Mark R and Finley Barbara L
Home Financials for this Owner
Home Financials are based on the most recent Mortgage that was taken out on this home.
Original Mortgage
$167,200
Interest Rate
5.79%
Mortgage Type
New Conventional
Create a Home Valuation Report for This Property
The Home Valuation Report is an in-depth analysis detailing your home's value as well as a comparison with similar homes in the area
Home Values in the Area
Average Home Value in this Area
Purchase History
| Date | Buyer | Sale Price | Title Company |
|---|---|---|---|
| Neal Mark W | -- | None Available | |
| Neal Mark W | -- | -- | |
| Neal Mark W | -- | -- | |
| Finley Mark R | -- | -- |
Source: Public Records
Mortgage History
| Date | Status | Borrower | Loan Amount |
|---|---|---|---|
| Open | Neal Mark W | $194,250 | |
| Closed | Neal Mark W | $168,750 | |
| Previous Owner | Finley Mark R | $167,200 |
Source: Public Records
Tax History Compared to Growth
Tax History
| Year | Tax Paid | Tax Assessment Tax Assessment Total Assessment is a certain percentage of the fair market value that is determined by local assessors to be the total taxable value of land and additions on the property. | Land | Improvement |
|---|---|---|---|---|
| 2025 | $2,756 | $423,600 | $41,500 | $382,100 |
| 2024 | $2,756 | $415,700 | $41,500 | $374,200 |
| 2023 | $2,690 | $377,100 | $41,500 | $335,600 |
| 2022 | $2,678 | $350,900 | $41,500 | $309,400 |
| 2021 | $2,403 | $299,600 | $41,500 | $258,100 |
| 2020 | $2,414 | $300,000 | $41,500 | $258,500 |
| 2019 | $2,221 | $284,500 | $41,500 | $243,000 |
| 2018 | $2,097 | $272,200 | $41,500 | $230,700 |
| 2017 | $2,002 | $268,800 | $41,500 | $227,300 |
| 2016 | $1,816 | $253,800 | $41,500 | $212,300 |
| 2014 | $1,759 | $256,900 | $41,500 | $215,400 |
| 2013 | $1,975 | $253,900 | $42,100 | $211,800 |
Source: Public Records
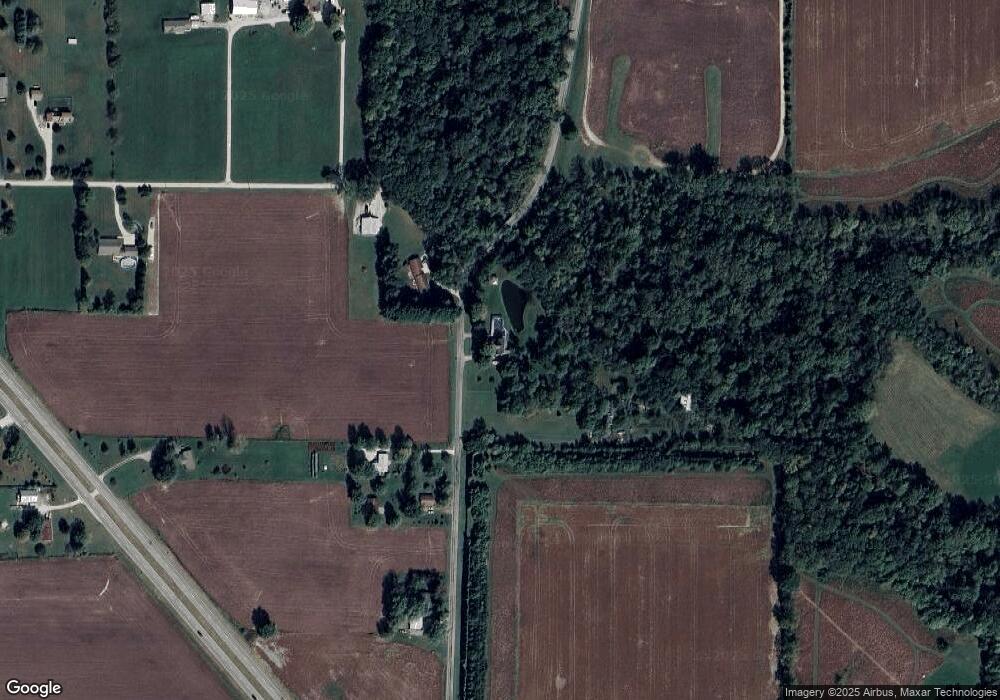
Map
Nearby Homes
- 5571 W 700 N
- 5593 W 700 N
- 6823 N US Highway 52
- 5779 W State Road 47
- 6433 W State Road 47
- 6691 Indiana 47
- 328 N Front St
- 6519 N 350 W
- 117 N Market St
- 223 S West St
- 1321 Locust Place
- 1323 Locust Place
- 4535 N Us Hwy 52
- Ironwood Plan at Northwood Haven
- Spruce Plan at Northwood Haven
- Ashton Plan at Northwood Haven
- Palmetto Plan at Northwood Haven
- Bradford Plan at Northwood Haven
- Aspen II Plan at Northwood Haven
- Empress Plan at Northwood Haven
- 6946 N Frankfort Rd
- 6850 N Frankfort Rd
- 6877 N Frankfort Rd
- 6834 N Frankfort Rd
- 6770 N Frankfort Rd
- 6823 U S 52
- 5635 W 700 N
- 5568 W 700 N
- 5568 W 700 N
- 5602 W 700 N
- 7185 N Frankfort Rd
- 6820 N Us Highway 52
- 5656 W 700 N
- 5789 W 700 N
- 6856 U S 52
- 6856 N Us Highway 52
- 6596 N Us Highway 52
- 7360 N Frankfort Rd
- 5710 W 700 N
- 6560 N Frankfort Rd