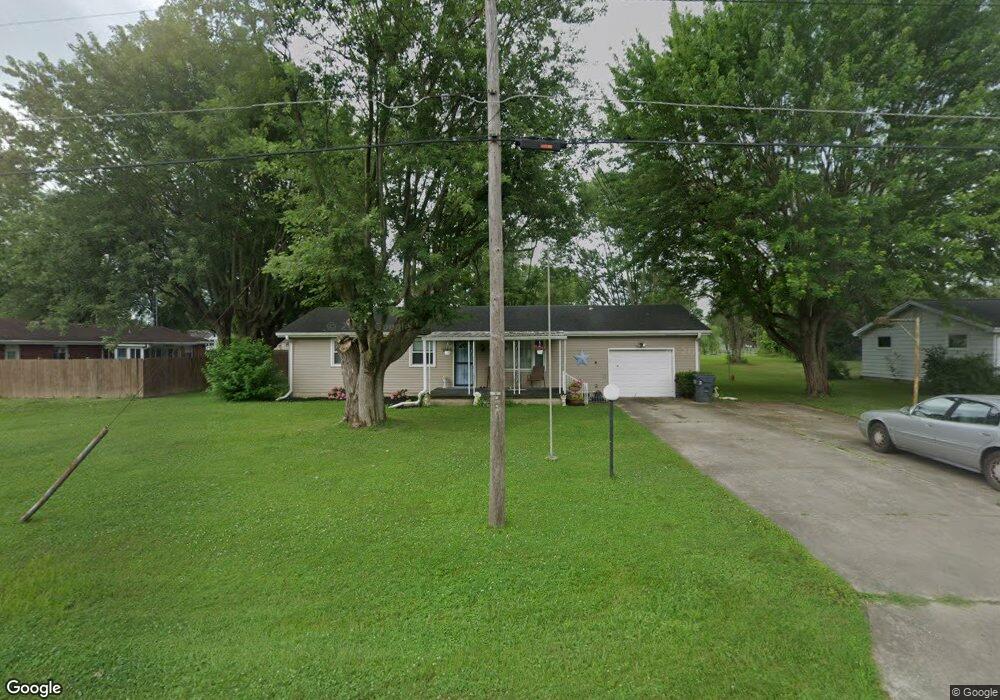
6909 E Torrence St Muncie, IN 47303
Estimated Value: $140,000 - $182,000
3
Beds
2
Baths
1,341
Sq Ft
$119/Sq Ft
Est. Value
About This Home
This home is located at 6909 E Torrence St, Muncie, IN 47303 and is currently estimated at $159,643, approximately $119 per square foot. 6909 E Torrence St is a home located in Delaware County with nearby schools including Selma Elementary School, Selma Middle School, and Wapahani High School.
Ownership History
Date
Name
Owned For
Owner Type
Purchase Details
Closed on
Dec 31, 2013
Sold by
Bower Stephen E
Bought by
Bower Stephen E and Bower Gennie L
Current Estimated Value
Purchase Details
Closed on
Jan 19, 2009
Sold by
Bower Vada M
Bought by
Bower Stephen E
Create a Home Valuation Report for This Property
The Home Valuation Report is an in-depth analysis detailing your home's value as well as a comparison with similar homes in the area
Purchase History
| Date | Buyer | Sale Price | Title Company |
|---|---|---|---|
| Bower Stephen E | -- | -- | |
| Bower Stephen E | -- | None Available |
Source: Public Records
Tax History
| Year | Tax Paid | Tax Assessment Tax Assessment Total Assessment is a certain percentage of the fair market value that is determined by local assessors to be the total taxable value of land and additions on the property. | Land | Improvement |
|---|---|---|---|---|
| 2025 | $297 | $120,000 | $13,800 | $106,200 |
| 2024 | $297 | $99,800 | $13,800 | $86,000 |
| 2023 | $291 | $99,800 | $13,800 | $86,000 |
| 2022 | $374 | $100,800 | $13,800 | $87,000 |
| 2021 | $260 | $86,500 | $10,700 | $75,800 |
| 2020 | $145 | $73,000 | $9,800 | $63,200 |
| 2019 | $140 | $73,000 | $9,800 | $63,200 |
| 2018 | $134 | $73,000 | $9,800 | $63,200 |
| 2017 | $169 | $78,500 | $9,800 | $68,700 |
| 2016 | $126 | $71,800 | $9,300 | $62,500 |
| 2014 | $220 | $83,400 | $9,300 | $74,100 |
| 2013 | -- | $82,600 | $9,300 | $73,300 |
Source: Public Records
Map
Nearby Homes
- 700 N Cook Rd
- 5909 E Robert St
- 401 N Gray St
- 4838 E Jackson St
- 4708 E Heritage Cir
- 4705 E Heritage Cir
- 2300 N Country Club Rd
- 411 N State St
- 2510 S Whitney Rd
- 616 N Edgewood Dr
- 1905 N Garnet Ave
- 2108 N Rector Ave
- 701 N Claypool Rd
- 4308 E Maple Manor Pkwy
- 103 S Delawanda Ave
- 300 N Biltmore Ave
- 10600 E County Road 50 S
- 606 N Biltmore Ave
- 305 N Biltmore Ave
- 1523 S Burlington Dr
- 6905 E Torrence St
- 311 N Cook Rd
- 301 N Cook Rd
- 6901 E Torrence St
- 6910 E Torrence St
- 401 N Cook Rd
- 6904 E Torrence St
- 314 N Cook Rd
- 310 N Cook Rd
- 6813 E Torrence St
- 400 N Cook Rd
- 205 N Cook Rd
- 300 N Cook Rd
- 408 N Cook Rd
- 300 N Truitt Rd
- 214 N Truitt Rd
- 6909 E Aubrey Ln
- 310 N Truitt Rd
- 314 N Truitt Rd
- 208 N Cook Rd
Your Personal Tour Guide
Ask me questions while you tour the home.