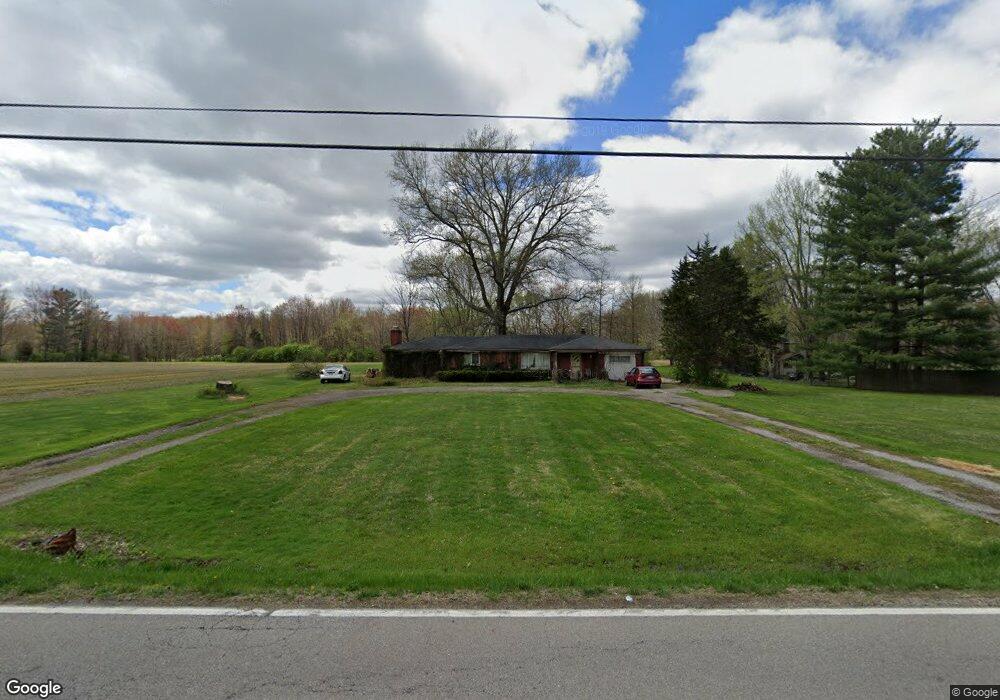
6909 Morrow Rossburg Rd Morrow, OH 45152
Estimated Value: $279,000 - $353,000
2
Beds
2
Baths
1,426
Sq Ft
$222/Sq Ft
Est. Value
About This Home
This home is located at 6909 Morrow Rossburg Rd, Morrow, OH 45152 and is currently estimated at $315,874, approximately $221 per square foot. 6909 Morrow Rossburg Rd is a home located in Warren County with nearby schools including Little Miami Early Childhood Center, Little Miami Intermediate Middle School, and Little Miami Middle School.
Ownership History
Date
Name
Owned For
Owner Type
Purchase Details
Closed on
Oct 29, 2024
Sold by
Gish Thomas A and Gish Joyce M
Bought by
Gish Thomas A and Gish Joyce M
Current Estimated Value
Purchase Details
Closed on
Dec 12, 1988
Sold by
Scott Roger D and Scott Connie R
Bought by
Gish and Gish Thomas A
Purchase Details
Closed on
Jul 31, 1987
Sold by
White Kathy Elaine and Elaine Kathy
Bought by
Scott and Scott Roger D
Purchase Details
Closed on
Oct 17, 1986
Sold by
White Russell A and White Kathy
Bought by
White and Kathy Elaine
Purchase Details
Closed on
Jan 14, 1985
Sold by
Rose David W and Rose David W
Bought by
White and White Russell A
Purchase Details
Closed on
Sep 14, 1984
Sold by
Rose Rose and Rose David W
Bought by
First National Bank Of Wa
Purchase Details
Closed on
Mar 25, 1983
Sold by
Rose David W and Joyce A.
Bought by
Rose and Rose David W
Purchase Details
Closed on
Feb 14, 1978
Sold by
Phelps Phelps and Phelps Raymond Earl
Create a Home Valuation Report for This Property
The Home Valuation Report is an in-depth analysis detailing your home's value as well as a comparison with similar homes in the area
Home Values in the Area
Average Home Value in this Area
Purchase History
| Date | Buyer | Sale Price | Title Company |
|---|---|---|---|
| Gish Thomas A | -- | None Listed On Document | |
| Gish | $69,000 | -- | |
| Scott | $64,000 | -- | |
| White | -- | -- | |
| White | $60,000 | -- | |
| First National Bank Of Wa | -- | -- | |
| Rose | -- | -- | |
| -- | $45,000 | -- |
Source: Public Records
Tax History
| Year | Tax Paid | Tax Assessment Tax Assessment Total Assessment is a certain percentage of the fair market value that is determined by local assessors to be the total taxable value of land and additions on the property. | Land | Improvement |
|---|---|---|---|---|
| 2025 | $2,908 | $64,510 | $21,610 | $42,900 |
| 2024 | $2,908 | $64,510 | $21,610 | $42,900 |
| 2023 | $2,602 | $51,415 | $13,328 | $38,087 |
| 2022 | $2,575 | $51,415 | $13,328 | $38,087 |
| 2021 | $2,461 | $51,415 | $13,328 | $38,087 |
| 2020 | $2,351 | $41,801 | $10,836 | $30,965 |
| 2019 | $2,392 | $41,801 | $10,836 | $30,965 |
| 2018 | $2,432 | $41,801 | $10,836 | $30,965 |
| 2017 | $2,250 | $37,912 | $9,937 | $27,976 |
| 2016 | $2,296 | $37,912 | $9,937 | $27,976 |
| 2015 | $2,151 | $37,912 | $9,937 | $27,976 |
| 2014 | $2,184 | $34,490 | $9,060 | $25,430 |
| 2013 | $2,148 | $41,200 | $10,780 | $30,420 |
Source: Public Records
Map
Nearby Homes
- 5750 Azra Ct
- 6017 Outlook Ct
- 4054 E Foster Maineville Rd
- 4798 Sullivans Ridge Dr
- 7152 Gheils Carroll Rd
- 6490 Cooper Grace Ln
- 5015 Allens Ridge Dr
- 5168 Allens Ridge Dr
- 4698 Jessica Suzanne Dr
- 3155 Rosemary Ct Unit Lot 94
- 3155 Rosemary Ct
- 4836 Jessica Suzanne Dr
- 3292 Shadow Ridge Ct
- 5815 Josie’s Cove
- 6448 Cooper Grace Ln
- 5441 Hopewell Valley Dr
- 5670 Julia Kate Dr
- Lot #1 Middleboro Rd
- 4997 Jessica Suzanne Dr
- 114 Highlawn Ave
- 6875 Morrow Rossburg Rd
- 6855 Morrow Rossburg Rd
- 6987 Morrow Rossburg Rd
- 6795 Morrow Rossburg Rd
- 6822 Morrow Rossburg Rd
- 6779 Morrow Rossburg Rd
- 6848 Morrow Rossburg Rd
- 7022 Morrow Rossburg Rd
- 6746 Morrow Rossburg Rd
- 6698 Morrow Rossburg Rd
- 7114 Morrow Rossburg Rd
- 15 Morrow Meadow Dr
- 7711 Misty Meadows Ct
- 7706 Misty Meadows Ct
- 7711 Misty Meadows Ct Unit 21
- 7706 Misty Meadows Ct Unit 1
- 7126 Morrow Rossburg Rd
- 6670 Morrow Rossburg Rd
- 6179 Molly Joy Ct
- 5028 Ross Ridge
Your Personal Tour Guide
Ask me questions while you tour the home.