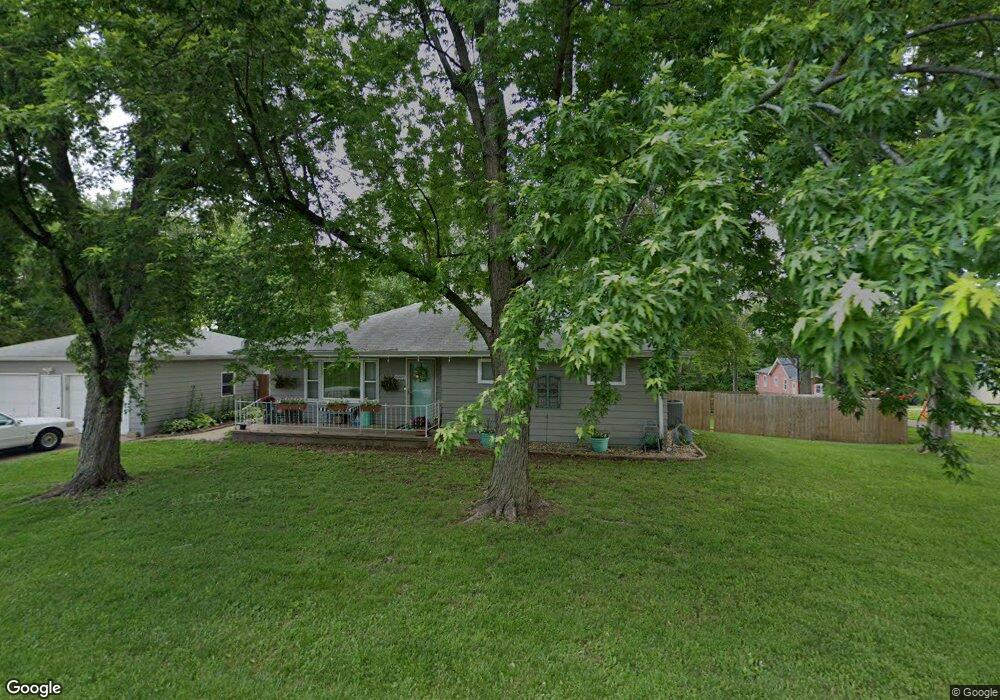
6909 S 21st St Bellevue, NE 68147
Estimated Value: $162,000 - $233,571
3
Beds
1
Bath
1,136
Sq Ft
$189/Sq Ft
Est. Value
About This Home
This home is located at 6909 S 21st St, Bellevue, NE 68147 and is currently estimated at $214,143, approximately $188 per square foot. 6909 S 21st St is a home located in Sarpy County with nearby schools including Chandler View Elementary School, Bryan Middle School, and Bryan High School.
Ownership History
Date
Name
Owned For
Owner Type
Purchase Details
Closed on
Sep 23, 2016
Sold by
Kibat Kathleen M and Kibat William M
Bought by
Joyce Jessica
Current Estimated Value
Home Financials for this Owner
Home Financials are based on the most recent Mortgage that was taken out on this home.
Original Mortgage
$88,369
Outstanding Balance
$71,303
Interest Rate
3.75%
Mortgage Type
FHA
Estimated Equity
$142,840
Purchase Details
Closed on
Oct 1, 2003
Sold by
Nary William M and Nary Doris J
Bought by
Nary William M and Nary Doris J
Home Financials for this Owner
Home Financials are based on the most recent Mortgage that was taken out on this home.
Original Mortgage
$50,000
Interest Rate
6.24%
Mortgage Type
Purchase Money Mortgage
Purchase Details
Closed on
Sep 29, 1999
Sold by
Nary William M and Nary Doris J
Bought by
Nary William M and Nary Doris J
Create a Home Valuation Report for This Property
The Home Valuation Report is an in-depth analysis detailing your home's value as well as a comparison with similar homes in the area
Home Values in the Area
Average Home Value in this Area
Purchase History
| Date | Buyer | Sale Price | Title Company |
|---|---|---|---|
| Joyce Jessica | $90,000 | Dri Title & Escrow | |
| Nary William M | -- | Clean Title & Escrow Llc | |
| Nary William M | -- | Clean Title & Escrow Llc | |
| Nary William M | -- | -- |
Source: Public Records
Mortgage History
| Date | Status | Borrower | Loan Amount |
|---|---|---|---|
| Open | Joyce Jessica | $88,369 | |
| Previous Owner | Nary William M | $50,000 |
Source: Public Records
Tax History Compared to Growth
Tax History
| Year | Tax Paid | Tax Assessment Tax Assessment Total Assessment is a certain percentage of the fair market value that is determined by local assessors to be the total taxable value of land and additions on the property. | Land | Improvement |
|---|---|---|---|---|
| 2025 | $3,232 | $208,806 | $35,000 | $173,806 |
| 2024 | $3,840 | $191,475 | $35,000 | $156,475 |
| 2023 | $3,840 | $177,890 | $35,000 | $142,890 |
| 2022 | $3,585 | $164,235 | $35,000 | $129,235 |
| 2021 | $3,333 | $151,694 | $30,000 | $121,694 |
| 2020 | $3,137 | $141,856 | $30,000 | $111,856 |
| 2019 | $2,952 | $133,223 | $30,000 | $103,223 |
| 2018 | $2,844 | $127,424 | $30,000 | $97,424 |
| 2017 | $2,785 | $124,160 | $30,000 | $94,160 |
| 2016 | $2,687 | $120,622 | $30,000 | $90,622 |
| 2015 | -- | $121,683 | $38,000 | $83,683 |
| 2014 | -- | $115,855 | $30,000 | $85,855 |
| 2012 | -- | $116,290 | $30,000 | $86,290 |
Source: Public Records
Map
Nearby Homes
- 2214 Emiline St
- 7205 S 22nd St
- 7207 S 21st St
- 7204 S 21st St
- 2222 Lillian St
- 7525 Chandler Hills Dr
- 2516 Polk St
- 7415 S 20th St
- 1711 Madison St
- 2537 Monroe St
- 1504 Harrison St
- 2205 Myrtle St
- 7304 S 26th St
- 2502 Washington St
- 7306 Sarpy Ave
- 2015 W St
- 7602 Sarpy Ave
- 1911 W St
- 2816 Monroe St
- 5629 S 23rd St
- 6902 S 20th St
- 6901 S 21st Ave
- 6905 S 21st Ave
- 6910 S 20th St
- 7001 S 21st Ave
- 7005 S 21st Ave
- 7005 S 21st Ave
- 6920 S 20th St
- 2100 Polk St
- 2102 Harrison St
- 7009 S 21st Ave
- 6814 S 21st St
- 7002 S 21st Ave
- 7013 S 21st Ave
- 2110 Harrison St
- 2116 Emiline St
- 7010 S 21st Ave
- 7101 S 21st Ave
- 2105 Polk St
- 2204 Harrison St