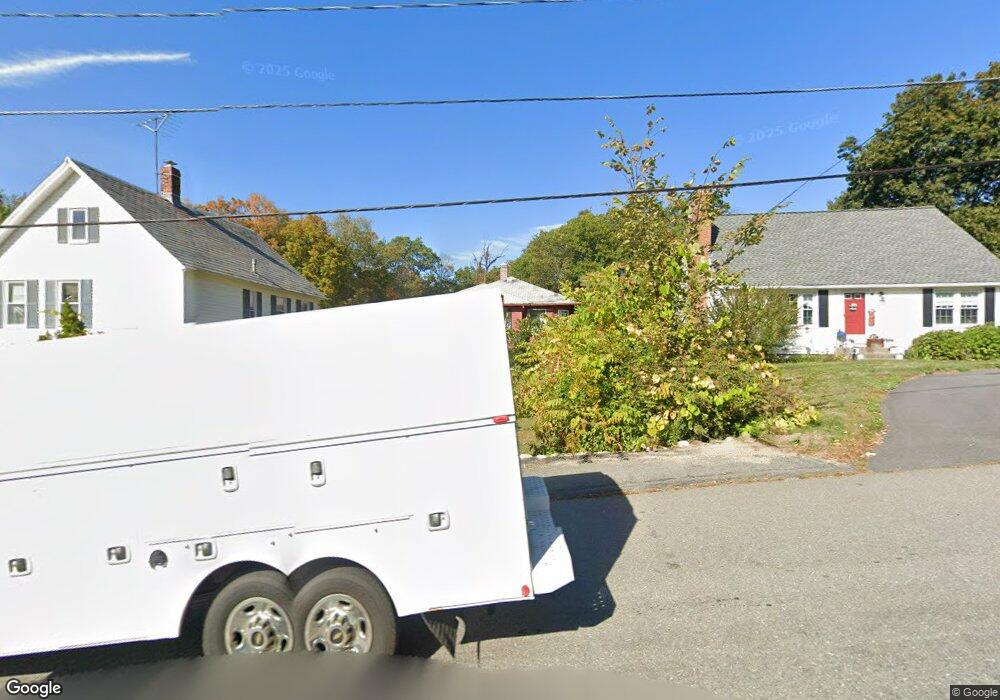
691 Blossom St Fitchburg, MA 01420
Estimated Value: $424,000 - $516,000
6
Beds
2
Baths
2,197
Sq Ft
$211/Sq Ft
Est. Value
About This Home
This home is located at 691 Blossom St, Fitchburg, MA 01420 and is currently estimated at $464,424, approximately $211 per square foot. 691 Blossom St is a home located in Worcester County with nearby schools including Crocker Elementary School, Fitchburg High School, and South Street Elementary School.
Ownership History
Date
Name
Owned For
Owner Type
Purchase Details
Closed on
Jul 30, 2007
Sold by
Chabot Jude H and Chabot Karen M
Bought by
Chabot Karen M
Current Estimated Value
Purchase Details
Closed on
May 14, 1998
Sold by
Heino Oni and Corliss Judith E
Bought by
Chabot Jude H and Chabot Karen M
Home Financials for this Owner
Home Financials are based on the most recent Mortgage that was taken out on this home.
Original Mortgage
$99,000
Interest Rate
7.08%
Mortgage Type
Purchase Money Mortgage
Create a Home Valuation Report for This Property
The Home Valuation Report is an in-depth analysis detailing your home's value as well as a comparison with similar homes in the area
Home Values in the Area
Average Home Value in this Area
Purchase History
| Date | Buyer | Sale Price | Title Company |
|---|---|---|---|
| Chabot Karen M | -- | -- | |
| Chabot Jude H | $110,000 | -- |
Source: Public Records
Mortgage History
| Date | Status | Borrower | Loan Amount |
|---|---|---|---|
| Previous Owner | Chabot Jude H | $99,000 |
Source: Public Records
Tax History Compared to Growth
Tax History
| Year | Tax Paid | Tax Assessment Tax Assessment Total Assessment is a certain percentage of the fair market value that is determined by local assessors to be the total taxable value of land and additions on the property. | Land | Improvement |
|---|---|---|---|---|
| 2025 | $54 | $401,500 | $104,500 | $297,000 |
| 2024 | $5,127 | $346,200 | $70,400 | $275,800 |
| 2023 | $4,854 | $303,000 | $54,000 | $249,000 |
| 2022 | $4,491 | $255,000 | $45,200 | $209,800 |
| 2021 | $4,000 | $210,200 | $32,700 | $177,500 |
| 2020 | $3,782 | $191,900 | $30,200 | $161,700 |
| 2019 | $3,631 | $177,200 | $42,700 | $134,500 |
| 2018 | $3,446 | $164,000 | $40,200 | $123,800 |
| 2017 | $3,217 | $149,700 | $40,200 | $109,500 |
| 2016 | $3,097 | $145,900 | $36,400 | $109,500 |
| 2015 | $2,912 | $140,800 | $35,200 | $105,600 |
| 2014 | $2,792 | $140,800 | $35,200 | $105,600 |
Source: Public Records
Map
Nearby Homes
- 0 Rindge Rd
- 468 Elm St Unit 3
- 218 Marshall St
- 205-207 High St
- 15 Will Thompson Way
- 202 High St
- 162 Fisher Rd
- 376 Elm St
- 21-23 Omena Place
- 33-35 Omena Place
- 62 Wendell Rd
- 68 Marshall St
- 1 High Rock Rd
- 179 Ashby State Rd
- 90 Mechanic St
- 50 Prospect St
- 21 Haskell St
- 94 Fitch Hill Ave
- 154 Pleasant St
- 208 Blossom St