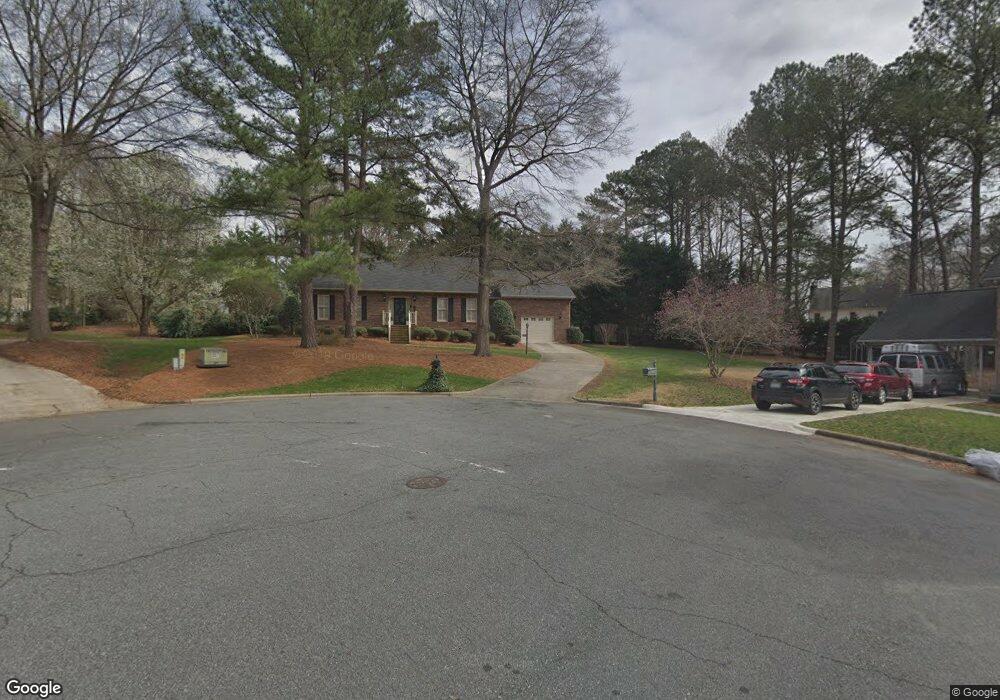
691 Crab Tree Ct SW Concord, NC 28025
Estimated Value: $324,000 - $363,000
3
Beds
2
Baths
1,499
Sq Ft
$228/Sq Ft
Est. Value
About This Home
This home is located at 691 Crab Tree Ct SW, Concord, NC 28025 and is currently estimated at $341,305, approximately $227 per square foot. 691 Crab Tree Ct SW is a home located in Cabarrus County with nearby schools including R Brown Mcallister STEMElementary, Concord Middle School, and Concord High School.
Ownership History
Date
Name
Owned For
Owner Type
Purchase Details
Closed on
Jun 1, 2021
Sold by
Somers Sandra K and Bost David Scott
Bought by
Bost Susan
Current Estimated Value
Home Financials for this Owner
Home Financials are based on the most recent Mortgage that was taken out on this home.
Original Mortgage
$213,064
Outstanding Balance
$192,903
Interest Rate
2.9%
Mortgage Type
FHA
Estimated Equity
$148,402
Purchase Details
Closed on
Sep 19, 2017
Sold by
Bost David Scott and Bost Teri
Bought by
Somers Sandra K
Purchase Details
Closed on
Jul 12, 2010
Sold by
Somers Sandra K
Bought by
Hill Susan Leslie Bost and Bost David Scott
Purchase Details
Closed on
Feb 1, 1994
Bought by
Somers Sandra K
Create a Home Valuation Report for This Property
The Home Valuation Report is an in-depth analysis detailing your home's value as well as a comparison with similar homes in the area
Home Values in the Area
Average Home Value in this Area
Purchase History
| Date | Buyer | Sale Price | Title Company |
|---|---|---|---|
| Bost Susan | $219,000 | None Available | |
| Somers Sandra K | -- | None Available | |
| Hill Susan Leslie Bost | -- | None Available | |
| Somers Sandra K | $22,000 | -- |
Source: Public Records
Mortgage History
| Date | Status | Borrower | Loan Amount |
|---|---|---|---|
| Open | Bost Susan | $213,064 |
Source: Public Records
Tax History Compared to Growth
Tax History
| Year | Tax Paid | Tax Assessment Tax Assessment Total Assessment is a certain percentage of the fair market value that is determined by local assessors to be the total taxable value of land and additions on the property. | Land | Improvement |
|---|---|---|---|---|
| 2025 | $3,339 | $335,220 | $93,600 | $241,620 |
| 2024 | $3,339 | $335,220 | $93,600 | $241,620 |
| 2023 | $2,260 | $185,250 | $48,000 | $137,250 |
| 2022 | $2,260 | $185,250 | $48,000 | $137,250 |
| 2021 | $2,260 | $185,250 | $48,000 | $137,250 |
| 2020 | $2,260 | $185,250 | $48,000 | $137,250 |
| 2019 | $1,951 | $159,910 | $43,200 | $116,710 |
| 2018 | $1,919 | $159,910 | $43,200 | $116,710 |
| 2017 | $1,887 | $159,910 | $43,200 | $116,710 |
| 2016 | $1,119 | $151,340 | $43,200 | $108,140 |
| 2015 | $1,786 | $151,340 | $43,200 | $108,140 |
| 2014 | $1,786 | $151,340 | $43,200 | $108,140 |
Source: Public Records
Map
Nearby Homes
- 269 Fryling Ave SW
- 309 Brightwood Ct SW
- 671 Sedgefield St SW
- 159 Fryling Ave SW
- 80 Pounds Ave SW
- 736 Spring St SW
- 111 Wilshire Ave SW
- 782 Union St S
- 783 Union St S
- 358 Cozart Ave SW
- 569 Union St S
- 571 Union St S
- 24 Doris Ct SE
- 34 Rollingwood Dr SE
- 23 Lawndale Ave SE
- 85 Myrtle Ave SW
- 00 Rollingwood Ln
- 66 Arlington Ave SE
- 336 Lincoln St SW
- 229 Boger Ct SW
- 689 Crab Tree Ct SW
- 694 Journey St SW
- 268 Fryling Ave SW
- 692 Crab Tree Ct SW
- 692 Journey St SW
- 696 Journey St SW
- 270 Fryling Ave SW
- 690 Crab Tree Ct SW
- 272 Fryling Ave SW
- 690 Journey St SW
- 687 Crab Tree Ct SW
- 688 Crab Tree Ct SW
- 274 Fryling Ave SW
- 278 Fryling Ave SW
- 276 Fryling Ave SW
- 688 Journey St SW
- 263 Fryling Ave SW
- 280 Fryling Ave SW
- 264 Fryling Ave SW
- 693 Journey St SW