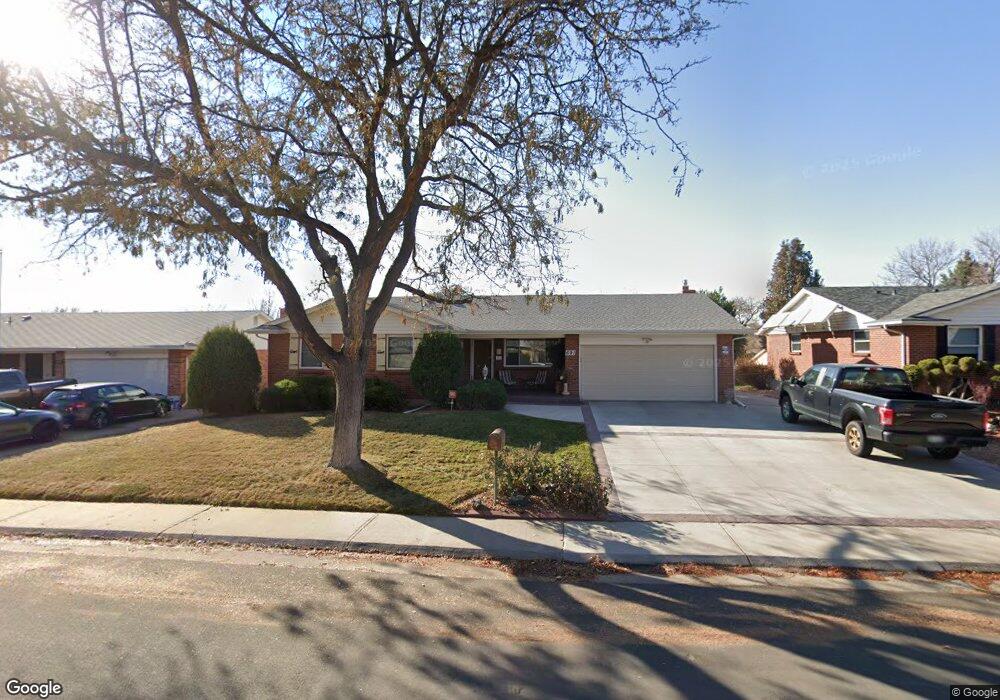
691 S Oswego Ct Aurora, CO 80012
Expo Park NeighborhoodEstimated Value: $430,000 - $485,000
3
Beds
2
Baths
1,512
Sq Ft
$305/Sq Ft
Est. Value
About This Home
This home is located at 691 S Oswego Ct, Aurora, CO 80012 and is currently estimated at $460,475, approximately $304 per square foot. 691 S Oswego Ct is a home located in Arapahoe County with nearby schools including Highline Community Elementary School, Prairie Middle School, and Overland High School.
Ownership History
Date
Name
Owned For
Owner Type
Purchase Details
Closed on
Oct 26, 2012
Sold by
Nieto Manny and Romero Ai Christina
Bought by
Romero Ai Christina and Nieto Juan Manuel
Current Estimated Value
Home Financials for this Owner
Home Financials are based on the most recent Mortgage that was taken out on this home.
Original Mortgage
$120,000
Outstanding Balance
$21,474
Interest Rate
3.52%
Mortgage Type
New Conventional
Estimated Equity
$439,001
Purchase Details
Closed on
Feb 15, 1999
Sold by
Kwon Sun Soon
Bought by
Nieto Manny and Romero Ai Christina
Home Financials for this Owner
Home Financials are based on the most recent Mortgage that was taken out on this home.
Original Mortgage
$121,275
Interest Rate
6.78%
Purchase Details
Closed on
Sep 8, 1992
Sold by
Conversion Arapco
Bought by
Kwon Sun Soon
Purchase Details
Closed on
Mar 1, 1984
Sold by
Conversion Arapco
Bought by
Conversion Arapco
Purchase Details
Closed on
Jul 4, 1776
Bought by
Conversion Arapco
Create a Home Valuation Report for This Property
The Home Valuation Report is an in-depth analysis detailing your home's value as well as a comparison with similar homes in the area
Home Values in the Area
Average Home Value in this Area
Purchase History
| Date | Buyer | Sale Price | Title Company |
|---|---|---|---|
| Romero Ai Christina | -- | Lsi | |
| Nieto Manny | $134,750 | -- | |
| Kwon Sun Soon | -- | -- | |
| Conversion Arapco | -- | -- | |
| Conversion Arapco | -- | -- |
Source: Public Records
Mortgage History
| Date | Status | Borrower | Loan Amount |
|---|---|---|---|
| Open | Romero Ai Christina | $120,000 | |
| Closed | Nieto Manny | $121,275 |
Source: Public Records
Tax History Compared to Growth
Tax History
| Year | Tax Paid | Tax Assessment Tax Assessment Total Assessment is a certain percentage of the fair market value that is determined by local assessors to be the total taxable value of land and additions on the property. | Land | Improvement |
|---|---|---|---|---|
| 2024 | $2,085 | $30,143 | -- | -- |
| 2023 | $2,085 | $30,143 | $0 | $0 |
| 2022 | $1,763 | $24,346 | $0 | $0 |
| 2021 | $1,775 | $24,346 | $0 | $0 |
| 2020 | $1,751 | $24,389 | $0 | $0 |
| 2019 | $1,690 | $24,389 | $0 | $0 |
| 2018 | $1,472 | $19,966 | $0 | $0 |
| 2017 | $1,451 | $19,966 | $0 | $0 |
| 2016 | $1,216 | $15,697 | $0 | $0 |
| 2015 | $1,157 | $15,697 | $0 | $0 |
| 2014 | -- | $11,033 | $0 | $0 |
| 2013 | -- | $12,260 | $0 | $0 |
Source: Public Records
Map
Nearby Homes
- 607 S Oswego Ct
- 809 S Nome St
- 12161 E Center Dr
- 841 S Oakland St
- 11623 E Virginia Dr
- 11812 E Alaska Ave
- 11621 E Ada Place
- 912 S Peoria St
- 11759 E Alaska Ave
- 11973 E Kepner Dr
- 932 S Peoria St Unit 932
- 11996 E Kepner Dr
- 11955 E Ford Dr
- 12055 E Tennessee Ave
- 12434 E Alaska Ave
- 11945 E Ford Dr
- 666 S Quentin St
- 12204 E Dakota Ave
- 811 S Macon Way
- 906 S Moline St
- 687 S Oswego Ct
- 697 S Oswego Ct
- 692 S Oakland St
- 696 S Oakland St
- 677 S Oswego Ct
- 686 S Oakland St
- 692 S Oswego Ct
- 698 S Oswego Ct
- 688 S Oswego Ct
- 680 S Oakland St
- 671 S Oswego Ct
- 682 S Oswego Ct
- 701 S Oswego Ct
- 699 S Oakland St
- 689 S Oswego St
- 676 S Oakland St
- 11900 E Exposition Ave
- 730 S Oakland St
- 683 S Oswego St
- 685 S Oakland St