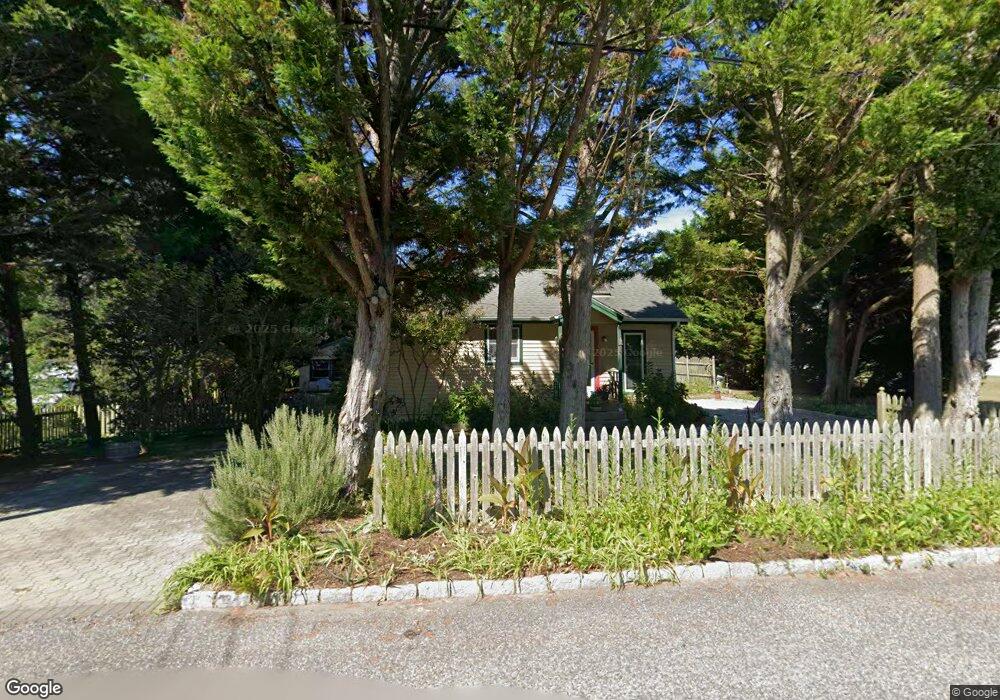
691 Socs Ln Cape May, NJ 08204
Estimated Value: $759,254 - $1,032,000
--
Bed
--
Bath
1,268
Sq Ft
$709/Sq Ft
Est. Value
About This Home
This home is located at 691 Socs Ln, Cape May, NJ 08204 and is currently estimated at $899,064, approximately $709 per square foot. 691 Socs Ln is a home located in Cape May County with nearby schools including Carl T. Mitnick School, David C. Douglass Veterans Memorial School, and Maud Abrams School.
Ownership History
Date
Name
Owned For
Owner Type
Purchase Details
Closed on
Oct 15, 1997
Sold by
Bergren Michael
Bought by
Dimartino James A
Current Estimated Value
Home Financials for this Owner
Home Financials are based on the most recent Mortgage that was taken out on this home.
Original Mortgage
$138,000
Outstanding Balance
$22,191
Interest Rate
7.46%
Estimated Equity
$876,873
Create a Home Valuation Report for This Property
The Home Valuation Report is an in-depth analysis detailing your home's value as well as a comparison with similar homes in the area
Home Values in the Area
Average Home Value in this Area
Purchase History
| Date | Buyer | Sale Price | Title Company |
|---|---|---|---|
| Dimartino James A | $190,000 | -- |
Source: Public Records
Mortgage History
| Date | Status | Borrower | Loan Amount |
|---|---|---|---|
| Open | Dimartino James A | $138,000 |
Source: Public Records
Tax History Compared to Growth
Tax History
| Year | Tax Paid | Tax Assessment Tax Assessment Total Assessment is a certain percentage of the fair market value that is determined by local assessors to be the total taxable value of land and additions on the property. | Land | Improvement |
|---|---|---|---|---|
| 2025 | $6,984 | $344,400 | $248,900 | $95,500 |
| 2024 | $6,984 | $344,400 | $248,900 | $95,500 |
| 2023 | $6,885 | $344,400 | $248,900 | $95,500 |
| 2022 | $6,674 | $344,400 | $248,900 | $95,500 |
| 2021 | $6,475 | $344,400 | $248,900 | $95,500 |
| 2020 | $6,371 | $344,400 | $248,900 | $95,500 |
| 2019 | $6,213 | $344,400 | $248,900 | $95,500 |
| 2018 | $6,065 | $344,400 | $248,900 | $95,500 |
| 2017 | $6,072 | $344,400 | $248,900 | $95,500 |
| 2016 | $5,979 | $344,400 | $248,900 | $95,500 |
| 2015 | $5,786 | $344,400 | $248,900 | $95,500 |
| 2014 | $5,597 | $344,400 | $248,900 | $95,500 |
Source: Public Records
Map
Nearby Homes