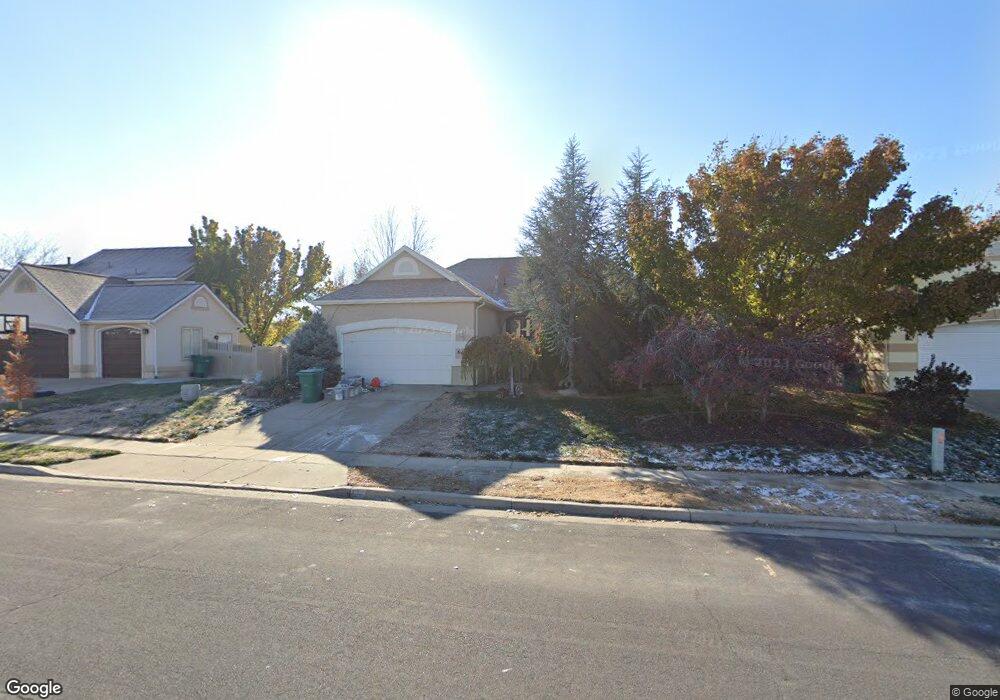
691 W 2175 N Layton, UT 84041
Estimated Value: $404,000 - $526,350
3
Beds
2
Baths
2,840
Sq Ft
$172/Sq Ft
Est. Value
About This Home
This home is located at 691 W 2175 N, Layton, UT 84041 and is currently estimated at $489,838, approximately $172 per square foot. 691 W 2175 N is a home located in Davis County with nearby schools including Lincoln Elementary School, North Layton Junior High School, and Northridge High School.
Ownership History
Date
Name
Owned For
Owner Type
Purchase Details
Closed on
Dec 31, 2012
Sold by
Hardison Cindy
Bought by
Hardison Nathan F
Current Estimated Value
Home Financials for this Owner
Home Financials are based on the most recent Mortgage that was taken out on this home.
Original Mortgage
$172,800
Outstanding Balance
$120,092
Interest Rate
3.36%
Mortgage Type
New Conventional
Estimated Equity
$369,746
Purchase Details
Closed on
May 27, 2010
Sold by
Bonnafon Lawrence W
Bought by
Hardison Nathan F and Hardison Cindy
Purchase Details
Closed on
Mar 13, 2003
Sold by
Rainey Homes Inc
Bought by
Bonnafon Lawrence W
Home Financials for this Owner
Home Financials are based on the most recent Mortgage that was taken out on this home.
Original Mortgage
$179,709
Interest Rate
5.83%
Mortgage Type
VA
Purchase Details
Closed on
Jan 9, 2003
Sold by
Burgess Scott N and Burgess Sara A
Bought by
Rainey Homes Inc
Purchase Details
Closed on
Jan 22, 1998
Sold by
Sli Commercial Real Estate Co
Bought by
Burgess Scott N and Burgess Sara A
Create a Home Valuation Report for This Property
The Home Valuation Report is an in-depth analysis detailing your home's value as well as a comparison with similar homes in the area
Home Values in the Area
Average Home Value in this Area
Purchase History
| Date | Buyer | Sale Price | Title Company |
|---|---|---|---|
| Hardison Nathan F | -- | None Available | |
| Hardison Nathan F | -- | Utah Commercial Title Co | |
| Bonnafon Lawrence W | -- | Heritage West Title Insuranc | |
| Rainey Homes Inc | -- | Heritage West Title Insuranc | |
| Burgess Scott N | -- | Security Title Company |
Source: Public Records
Mortgage History
| Date | Status | Borrower | Loan Amount |
|---|---|---|---|
| Open | Hardison Nathan F | $172,800 | |
| Previous Owner | Bonnafon Lawrence W | $179,709 |
Source: Public Records
Tax History Compared to Growth
Tax History
| Year | Tax Paid | Tax Assessment Tax Assessment Total Assessment is a certain percentage of the fair market value that is determined by local assessors to be the total taxable value of land and additions on the property. | Land | Improvement |
|---|---|---|---|---|
| 2024 | $2,263 | $239,250 | $120,898 | $118,352 |
| 2023 | $2,345 | $437,000 | $142,701 | $294,299 |
| 2022 | $2,402 | $243,100 | $75,755 | $167,345 |
| 2021 | $2,199 | $332,000 | $107,078 | $224,922 |
| 2020 | $1,996 | $289,000 | $89,755 | $199,245 |
| 2019 | $1,918 | $272,000 | $84,935 | $187,065 |
| 2018 | $1,763 | $251,000 | $84,935 | $166,065 |
| 2016 | $1,677 | $123,200 | $27,358 | $95,842 |
| 2015 | $1,714 | $119,515 | $27,358 | $92,157 |
| 2014 | $1,767 | $125,972 | $27,358 | $98,614 |
| 2013 | -- | $118,907 | $26,884 | $92,023 |
Source: Public Records
Map
Nearby Homes
- 781 W 2150 N
- 2211 N 525 W
- 2378 N 675 W
- 2187 N 450 W
- 2402 N 725 W
- 1837 N 440 W
- 1676 Forbes Ave W
- 2048 Evans Cove Loop
- 2044 Evans Cove Loop
- 2600 N Hill Field Rd Unit 4
- 2600 N Hill Field Rd Unit 138
- 2875 N Hill Field Rd Unit 58
- 2875 N Hill Field Rd Unit 17
- 2875 N Hill Field Rd Unit 62
- 1966 N 50 W
- 2500 N Fort Ln Unit 238
- 2500 N Fort Ln Unit 189
- 65 Sunset Dr
- 63 Sunset Dr
- 23 E 2150 N
- 703 W 2175 N
- 679 W 2175 N
- 2145 N 675 W
- 2139 N 675 W Unit 152
- 2139 N 675 W
- 2133 N 675 W
- 2146 N 725 W Unit 150
- 2203 N 700 W
- 665 W 2175 N
- 2131 N 675 W
- 713 W 2175 N
- 2163 N 650 W
- 2142 N 725 W Unit 149
- 690 W 2175 N
- 2140 N 725 W Unit 148
- 2127 N 675 W Unit 155
- 678 W 2175 N
- 2136 N 725 W Unit 147
- 2151 N 650 W
- 2132 N 725 W Unit 146