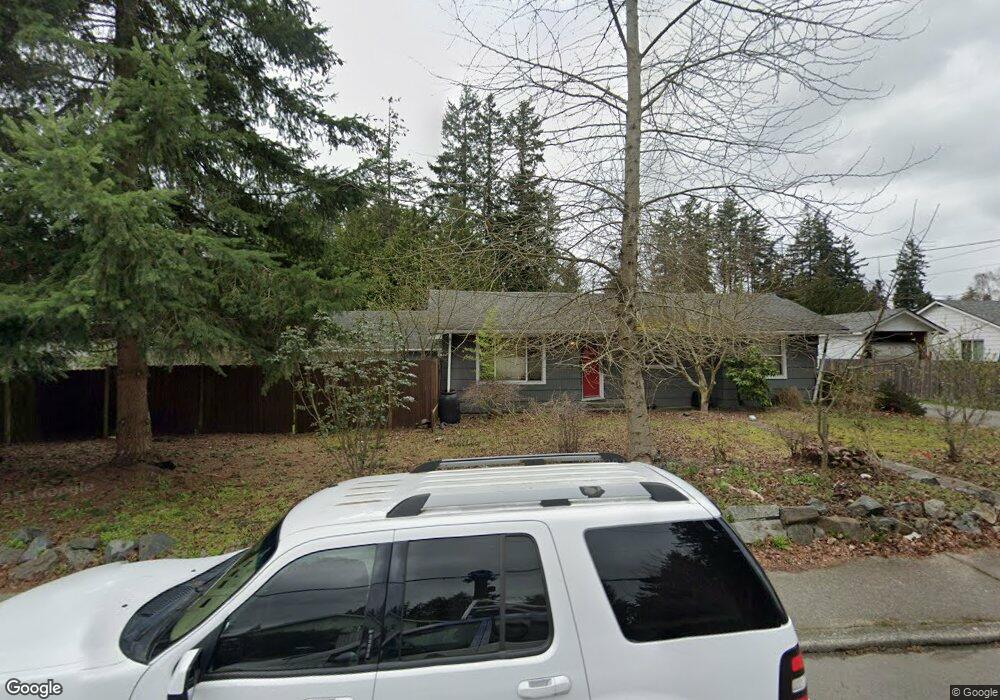
6910 Beverly Ln Everett, WA 98203
Evergreen NeighborhoodEstimated Value: $507,000 - $564,000
3
Beds
1
Bath
1,113
Sq Ft
$472/Sq Ft
Est. Value
About This Home
This home is located at 6910 Beverly Ln, Everett, WA 98203 and is currently estimated at $525,420, approximately $472 per square foot. 6910 Beverly Ln is a home located in Snohomish County with nearby schools including Madison Elementary School, Evergreen Middle School, and Cascade High School.
Ownership History
Date
Name
Owned For
Owner Type
Purchase Details
Closed on
Apr 22, 2011
Sold by
Marcum Brynn H
Bought by
Marcum Brynn H and Hurja Jared M
Current Estimated Value
Home Financials for this Owner
Home Financials are based on the most recent Mortgage that was taken out on this home.
Original Mortgage
$226,350
Outstanding Balance
$152,730
Interest Rate
4.72%
Mortgage Type
New Conventional
Estimated Equity
$372,690
Purchase Details
Closed on
Dec 15, 2006
Sold by
Schurig Ernest R and Schurig Beverly
Bought by
Marcum Brynn H
Home Financials for this Owner
Home Financials are based on the most recent Mortgage that was taken out on this home.
Original Mortgage
$232,500
Interest Rate
6.32%
Mortgage Type
Purchase Money Mortgage
Purchase Details
Closed on
Aug 26, 1999
Sold by
Castle Dwellers Inc
Bought by
Schurig Ernest R and Schurig Beverly
Home Financials for this Owner
Home Financials are based on the most recent Mortgage that was taken out on this home.
Original Mortgage
$134,094
Interest Rate
7.56%
Mortgage Type
FHA
Purchase Details
Closed on
Mar 26, 1999
Sold by
Burkett James C and Joann Burkett E
Bought by
Castle Dwellers Inc
Home Financials for this Owner
Home Financials are based on the most recent Mortgage that was taken out on this home.
Original Mortgage
$228,000
Interest Rate
6.73%
Purchase Details
Closed on
Jan 28, 1999
Sold by
Vik Arthur G and Vik Hildur E
Bought by
Burkett James C and Joann Burkett E
Home Financials for this Owner
Home Financials are based on the most recent Mortgage that was taken out on this home.
Original Mortgage
$228,000
Interest Rate
6.73%
Purchase Details
Closed on
Apr 1, 1997
Sold by
Sunmark Homes Llc
Bought by
Shuckerow Paul F and Shuckerow Lisa M
Home Financials for this Owner
Home Financials are based on the most recent Mortgage that was taken out on this home.
Original Mortgage
$135,609
Interest Rate
7.56%
Mortgage Type
VA
Purchase Details
Closed on
Jan 9, 1997
Sold by
Sunmark Homes Llc
Bought by
Selby Johnson Construction Inc
Home Financials for this Owner
Home Financials are based on the most recent Mortgage that was taken out on this home.
Original Mortgage
$191,250
Interest Rate
7.53%
Purchase Details
Closed on
Jan 8, 1997
Sold by
Sunmark Homes Llc
Bought by
Selby Johnson Construction Inc
Home Financials for this Owner
Home Financials are based on the most recent Mortgage that was taken out on this home.
Original Mortgage
$191,250
Interest Rate
7.53%
Create a Home Valuation Report for This Property
The Home Valuation Report is an in-depth analysis detailing your home's value as well as a comparison with similar homes in the area
Home Values in the Area
Average Home Value in this Area
Purchase History
| Date | Buyer | Sale Price | Title Company |
|---|---|---|---|
| Marcum Brynn H | -- | First American Title Ins Co | |
| Marcum Brynn H | $232,500 | Chicago Title | |
| Schurig Ernest R | $135,200 | Transnation Title Insurance | |
| Castle Dwellers Inc | $220,154 | Transnation Title Insurance | |
| Burkett James C | $190,000 | -- | |
| Shuckerow Paul F | $133,000 | -- | |
| Selby Johnson Construction Inc | $54,950 | Chicago Title Ins Co | |
| Selby Johnson Construction Inc | $55,000 | Chicago Title Ins Co |
Source: Public Records
Mortgage History
| Date | Status | Borrower | Loan Amount |
|---|---|---|---|
| Open | Marcum Brynn H | $226,350 | |
| Closed | Marcum Brynn H | $232,500 | |
| Previous Owner | Schurig Ernest R | $134,094 | |
| Previous Owner | Castle Dwellers Inc | $228,000 | |
| Previous Owner | Shuckerow Paul F | $135,609 | |
| Previous Owner | Selby Johnson Construction Inc | $191,250 | |
| Previous Owner | Selby Johnson Construction Inc | $108,750 |
Source: Public Records
Tax History
| Year | Tax Paid | Tax Assessment Tax Assessment Total Assessment is a certain percentage of the fair market value that is determined by local assessors to be the total taxable value of land and additions on the property. | Land | Improvement |
|---|---|---|---|---|
| 2026 | $4,001 | $503,800 | $376,300 | $127,500 |
| 2025 | $3,724 | $457,800 | $336,000 | $121,800 |
| 2024 | $3,724 | $432,500 | $310,700 | $121,800 |
| 2023 | $3,970 | $482,200 | $334,400 | $147,800 |
| 2022 | $2,981 | $324,700 | $228,600 | $96,100 |
| 2020 | $2,983 | $265,000 | $179,100 | $85,900 |
| 2019 | $2,768 | $247,500 | $162,900 | $84,600 |
| 2018 | $2,721 | $223,100 | $146,700 | $76,400 |
| 2017 | $2,381 | $194,500 | $126,000 | $68,500 |
| 2016 | $2,206 | $189,400 | $103,500 | $85,900 |
| 2015 | $1,960 | $158,400 | $89,100 | $69,300 |
| 2013 | $1,789 | $127,600 | $69,300 | $58,300 |
Source: Public Records
Map
Nearby Homes
- 6916 Beverly Ln
- 627 Madison St
- 323 75th St SE Unit A14
- 323 75th St SE Unit B10
- 615 75th St SE Unit C53
- 615 75th St SE Unit C52
- 820 Cady Rd Unit H203
- 820 Cady Rd Unit H304
- 820 Cady Rd Unit H101
- 820 Cady Rd Unit B305
- 820 Cady Rd Unit F103
- 747 75th St SE Unit B203
- 6705 Cady Rd
- 820 E Cady Rd Unit A304
- 6518 Cady Rd
- 6327 Polk Place
- 9 76th St SE
- 7027 Rainier Dr Unit E
- 7027 Rainier Dr Unit G
- 7027 Rainier Dr Unit A
- 7012 Beverly Ln
- 6922 Beverly Ln
- 6920 Beverly Ln
- 6920 Beverly Ln
- 7016 Beverly Ln
- 7016 Beverly Ln
- 6914 Beverly Ln
- 7020 Beverly Ln
- 7020 Beverly Ln
- 6908 Beverly Ln
- 6908 Beverly Ln Unit A&B
- 6909 Beverly Ln
- 7032 Beverly Ln
- 6904 Beverly Ln
- 220 N Cabot Rd
- 302 S Cabot Rd
- 6906 Beverly Ln
- 304 N Cabot Rd
- 310 N Cabot Rd
- 7101 Beverly Ln
Your Personal Tour Guide
Ask me questions while you tour the home.