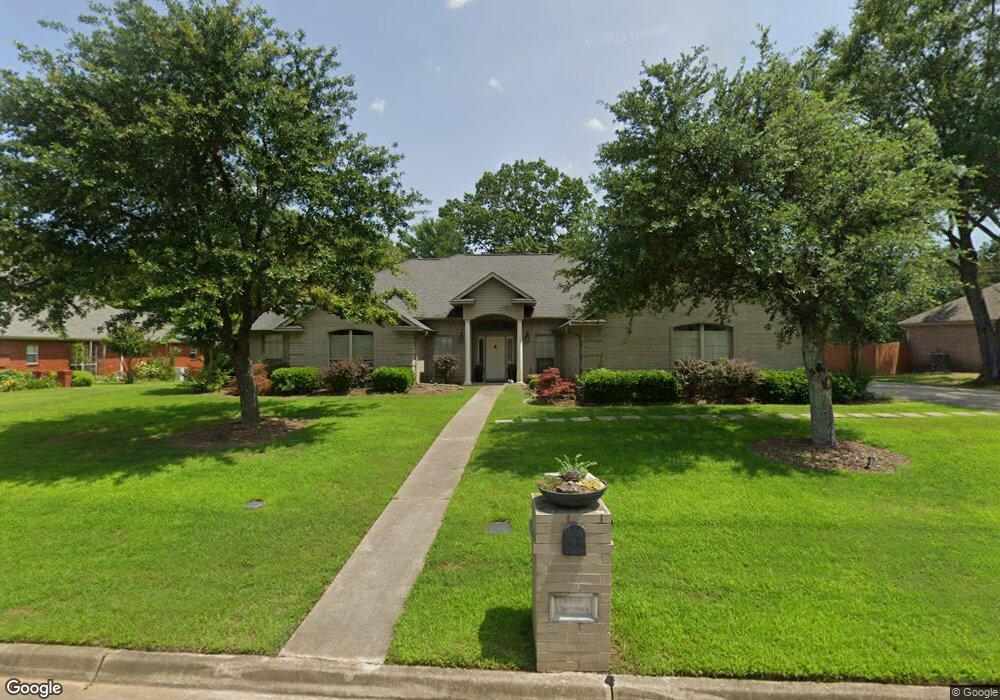
6910 Cherrybark Cir Texarkana, AR 71854
Estimated Value: $374,129 - $429,000
3
Beds
3
Baths
2,949
Sq Ft
$137/Sq Ft
Est. Value
About This Home
This home is located at 6910 Cherrybark Cir, Texarkana, AR 71854 and is currently estimated at $403,532, approximately $136 per square foot. 6910 Cherrybark Cir is a home located in Miller County with nearby schools including Arkansas High School, Trinity Christian School, and Veritas Academy.
Ownership History
Date
Name
Owned For
Owner Type
Purchase Details
Closed on
Dec 19, 2016
Sold by
Bigongiari Trust
Bought by
Banks Charlotte
Current Estimated Value
Home Financials for this Owner
Home Financials are based on the most recent Mortgage that was taken out on this home.
Original Mortgage
$233,700
Outstanding Balance
$190,665
Interest Rate
4.03%
Mortgage Type
New Conventional
Estimated Equity
$212,867
Purchase Details
Closed on
Oct 1, 2007
Sold by
Bartholomew Charles and Bartholomew Billie
Bought by
Bigongiari Lawrence R
Purchase Details
Closed on
Oct 3, 2002
Bought by
Bartholomew Charles
Purchase Details
Closed on
May 26, 2000
Bought by
Henderson Kristi M and Henderson Rex H
Purchase Details
Closed on
May 21, 1999
Bought by
Harms Rod L
Purchase Details
Closed on
Feb 1, 1999
Bought by
Mosbey Kerry G
Create a Home Valuation Report for This Property
The Home Valuation Report is an in-depth analysis detailing your home's value as well as a comparison with similar homes in the area
Purchase History
| Date | Buyer | Sale Price | Title Company |
|---|---|---|---|
| Banks Charlotte | $246,000 | -- | |
| Bigongiari Lawrence R | $245,000 | None Available | |
| Bartholomew Charles | $185,000 | -- | |
| Henderson Kristi M | $184,000 | -- | |
| Harms Rod L | $180,000 | -- | |
| Mosbey Kerry G | $32,000 | -- |
Source: Public Records
Mortgage History
| Date | Status | Borrower | Loan Amount |
|---|---|---|---|
| Open | Banks Charlotte | $233,700 |
Source: Public Records
Tax History
| Year | Tax Paid | Tax Assessment Tax Assessment Total Assessment is a certain percentage of the fair market value that is determined by local assessors to be the total taxable value of land and additions on the property. | Land | Improvement |
|---|---|---|---|---|
| 2025 | $2,598 | $71,850 | $11,440 | $60,410 |
| 2024 | $2,546 | $53,060 | $11,440 | $41,620 |
| 2023 | $2,488 | $53,060 | $11,440 | $41,620 |
| 2022 | $2,538 | $53,060 | $11,440 | $41,620 |
| 2021 | $2,538 | $53,060 | $11,440 | $41,620 |
| 2020 | $2,538 | $53,060 | $11,440 | $41,620 |
| 2019 | $2,501 | $52,380 | $11,440 | $40,940 |
| 2018 | $2,526 | $52,380 | $11,440 | $40,940 |
| 2017 | $2,526 | $52,380 | $11,440 | $40,940 |
| 2016 | $2,363 | $49,420 | $11,440 | $37,980 |
| 2015 | $2,363 | $49,420 | $11,440 | $37,980 |
| 2014 | $2,363 | $49,420 | $11,440 | $37,980 |
Source: Public Records
Map
Nearby Homes
- 6904 Cherrybark Cir
- TBD Sugar Hill Rd
- 9 Northern Hills Place
- 6708 Wuthering Heights Ln
- TBD 80 acres Arkansas 296
- 7102 Forest Oak Dr
- 7005 Forest Oak Dr
- 6902 Live Oak Dr
- 7102 Live Oak Dr
- 7405 Johna Cir
- 4103 Jack Cullen Dr
- 6516 Wuthering Heights Ln
- 3410 Water Oak Dr
- 7005 Tall Oaks
- 7101 Tall Oaks
- 6923 Sugarland Dr
- 3620 Northern Red Oak Trail
- 3517 Northern Red Oak Trail
- 6207 River Birch Way
- 3508 Southern Magnolia Ln
- 6914 Cherrybark Cir
- 6915 Cherrybark Cir
- 6911 Cherrybark Cir
- 7004 Cherrybark Cir
- 0 Cherrybark Cir
- 6907 Cherrybark Cir
- 7003 Cherrybark Cir
- 7008 Cherrybark Cir
- 7007 Cherrybark Cir
- 7012 Cherrybark Cir
- 7011 Cherrybark Cir
- 43.07 Acres Sugar Hill Rd
- 3811 Sugar Hill Rd
- 12 Northern Hills Place
- 8 Northern Hills Place
- 0 Sugar Hill Rd
- 2.322 Acres Sugar Hill Rd
- 4901 Sugar Hill Rd
- 5 Northern Hills Place
- 6801 Northern Hills Dr
Your Personal Tour Guide
Ask me questions while you tour the home.