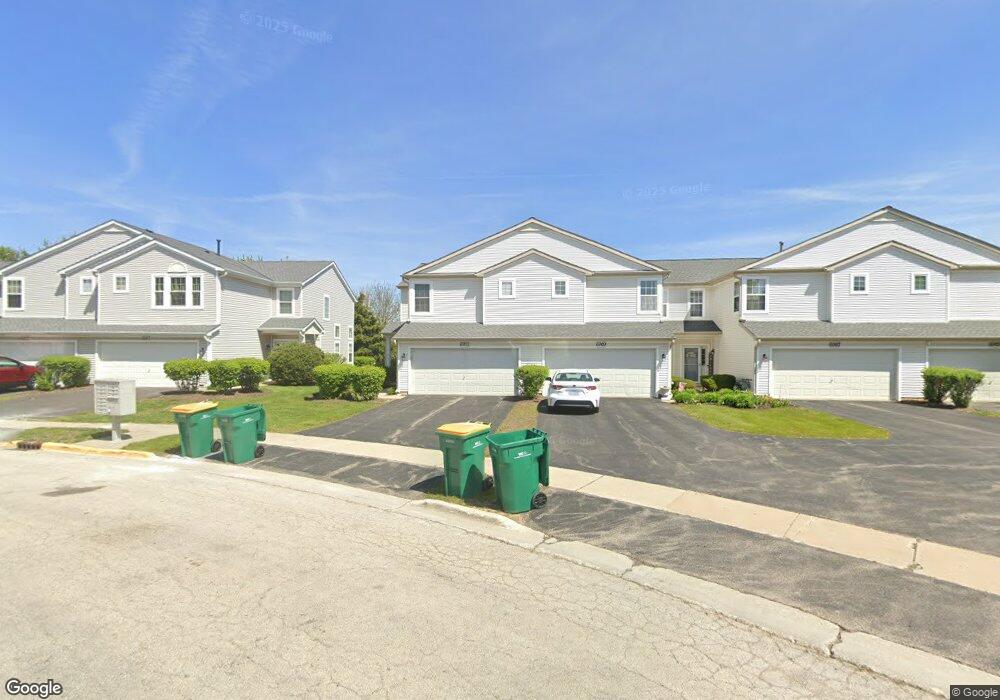
6911 Clearwater Dr Unit 51 Plainfield, IL 60586
Fall Creek NeighborhoodEstimated Value: $274,000 - $282,000
--
Bed
1
Bath
1,712
Sq Ft
$162/Sq Ft
Est. Value
About This Home
This home is located at 6911 Clearwater Dr Unit 51, Plainfield, IL 60586 and is currently estimated at $277,590, approximately $162 per square foot. 6911 Clearwater Dr Unit 51 is a home located in Will County with nearby schools including Meadow View Elementary School, Aux Sable Middle School, and Plainfield South High School.
Ownership History
Date
Name
Owned For
Owner Type
Purchase Details
Closed on
Jun 14, 2019
Sold by
Adams Matthew S
Bought by
Adams Matthew S and Adams Christine Marie
Current Estimated Value
Purchase Details
Closed on
Dec 13, 2017
Sold by
Standridge Kelyjean and Standridge Kelly Jean
Bought by
Adams Matthew S
Home Financials for this Owner
Home Financials are based on the most recent Mortgage that was taken out on this home.
Original Mortgage
$151,200
Interest Rate
3.94%
Mortgage Type
New Conventional
Purchase Details
Closed on
May 20, 2005
Sold by
Tiu Joseph D
Bought by
Standridge Kelly Jean
Purchase Details
Closed on
Dec 27, 2002
Sold by
Montalbano Builders Inc
Bought by
Tiu Joseph D
Home Financials for this Owner
Home Financials are based on the most recent Mortgage that was taken out on this home.
Original Mortgage
$139,700
Interest Rate
5.94%
Mortgage Type
FHA
Create a Home Valuation Report for This Property
The Home Valuation Report is an in-depth analysis detailing your home's value as well as a comparison with similar homes in the area
Home Values in the Area
Average Home Value in this Area
Purchase History
| Date | Buyer | Sale Price | Title Company |
|---|---|---|---|
| Adams Matthew S | -- | Attorney | |
| Adams Matthew S | $168,000 | Chicago Title Ins Co | |
| Standridge Kelly Jean | $171,000 | -- | |
| Tiu Joseph D | $144,500 | Chicago Title Insurance Co |
Source: Public Records
Mortgage History
| Date | Status | Borrower | Loan Amount |
|---|---|---|---|
| Previous Owner | Adams Matthew S | $151,200 | |
| Previous Owner | Tiu Joseph D | $139,700 |
Source: Public Records
Tax History Compared to Growth
Tax History
| Year | Tax Paid | Tax Assessment Tax Assessment Total Assessment is a certain percentage of the fair market value that is determined by local assessors to be the total taxable value of land and additions on the property. | Land | Improvement |
|---|---|---|---|---|
| 2024 | $5,004 | $77,673 | $1 | $77,672 |
| 2023 | $5,004 | $70,153 | $1 | $70,152 |
| 2022 | $4,477 | $63,006 | $1 | $63,005 |
| 2021 | $4,233 | $58,884 | $1 | $58,883 |
| 2020 | $4,163 | $57,213 | $1 | $57,212 |
| 2019 | $4,009 | $54,515 | $1 | $54,514 |
| 2018 | $3,826 | $51,219 | $1 | $51,218 |
| 2017 | $3,701 | $48,673 | $1 | $48,672 |
| 2016 | $3,617 | $46,422 | $1 | $46,421 |
| 2015 | $3,353 | $43,487 | $1 | $43,486 |
| 2014 | $3,353 | $41,952 | $1 | $41,951 |
| 2013 | $3,353 | $41,952 | $1 | $41,951 |
Source: Public Records
Map
Nearby Homes
- 6928 Creekside Dr Unit 83
- 7015 Clearwater Dr Unit 26
- 2916 Sierra Ave Unit 1
- 2900 Sierra Ave
- 6703 Bazz Dr Unit 3
- 2919 Discovery Dr
- 2922 Discovery Dr Unit 3
- 2807 Arches Ct
- 2707 Sierra Ave Unit 7
- 3000 Frank Turk Dr Unit 6
- 6614 Langsford Ln
- 25501 W Cerena Cir
- 17000 S Corinne Cir
- 25405 Rock Dr
- 2405 Twin Fountain Ct
- 16252 S Longcommon Ln
- 16514 S Mueller Cir
- 2509 Ruth Fitzgerald Dr
- 16151 S Lake View Rd
- 16513 S Mueller Cir
- 6911 Clearwater Dr Unit 1
- 6901 Clearwater Dr Unit 56
- 6903 Clearwater Dr Unit 55
- 6907 Clearwater Dr Unit 53
- 6905 Clearwater Dr Unit 54
- 6909 Clearwater Dr Unit 52
- 6907 Clearwater Dr
- 6925 Clearwater Dr Unit 41
- 6917 Clearwater Dr Unit 45
- 6915 Clearwater Dr Unit 46
- 6919 Clearwater Dr Unit 44
- 6921 Clearwater Dr Unit 43
- 6923 Clearwater Dr Unit 42
- 6915 Clearwater Dr Unit 1
- 6900 Creekside Dr Unit 61
- 6906 Creekside Dr Unit 64
- 6902 Creekside Dr Unit 62
- 6904 Creekside Dr Unit 63
- 6903 Creekside Dr Unit 163
- 6907 Creekside Dr Unit 161