6911 Shore Rd Unit 1C Brooklyn, NY 11209
Bay Ridge NeighborhoodEstimated payment $9,564/month
Highlights
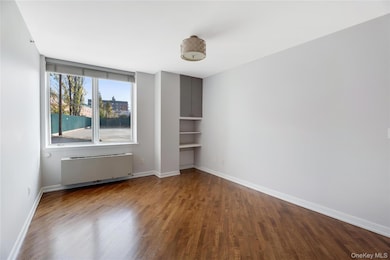
- Wood Flooring
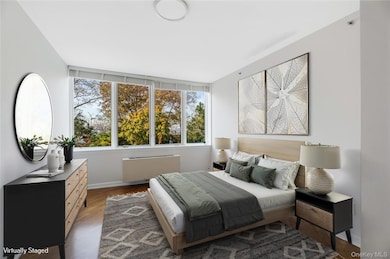
- Main Floor Bedroom
- Walk-In Closet
- P.S. 102 The Bayview School Rated A
- Granite Countertops
- 2-minute walk to American Veterans Memorial Pier
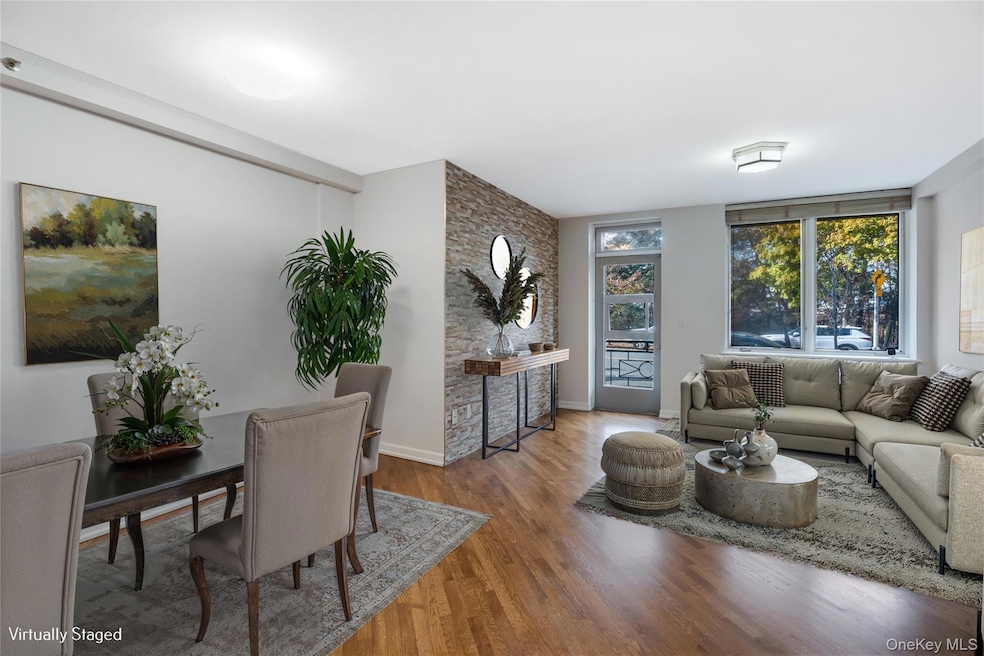
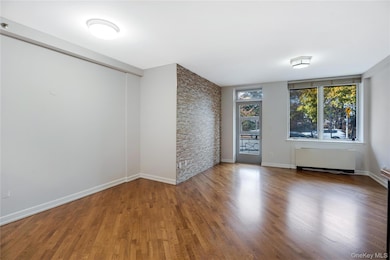
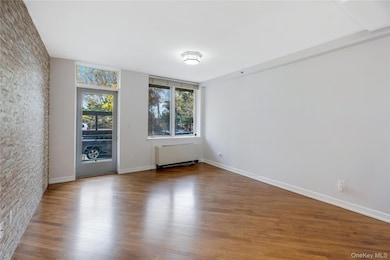
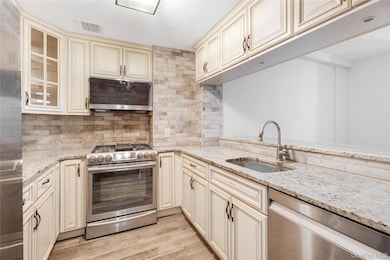
About This Home
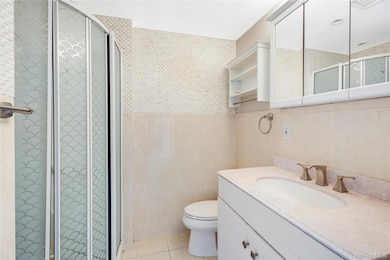
Discover a truly unique triplex condo in Bay Ridge that offers the space, comfort, and flexibility of a full-sized house—without sacrificing the convenience of condominium living. Spanning three thoughtfully designed levels, this exceptional residence delivers the kind of square footage that’s nearly impossible to find in NYC apartment living. The sunlit main floor greets you with an open-concept living and dining area featuring oversized windows, warm hardwood floors, and an easy flow ideal for entertaining. The chef-friendly kitchen offers abundant cabinet storage, prep space, and stainless steel appliances—perfect for everything from quick weeknight meals to weekend hosting. The upper level serves as your private retreat, with spacious bedrooms, impressive closet capacity, and tranquil separation from the main living areas. Downstairs, the expansive lower level unlocks true versatility: create a home gym, playroom, office suite, media lounge, or guest level—whatever your lifestyle demands. With this kind of square footage, you’ll finally have room to grow into your home, not out of it. Additional features include in-unit laundry, energy-efficient systems, and smart storage solutions on every floor. The boutique condominium is well-maintained, secure, and community-oriented—an ideal blend of privacy and ease. Private parking is available for a nominal monthly fee. All this sits just moments from Shore Road Park, the waterfront greenway, beloved Bay Ridge restaurants, local cafés, and excellent transportation options like the R train and express bus routes. If you’re looking for a spacious Bay Ridge triplex condo that lives like a house, offers rare flexibility, and positions you perfectly within one of Brooklyn’s most beloved neighborhoods—this is the home that finally checks every box.
Listing Agent
MYNY Residential Brokerage Email: colette.desantis@cbrnyc.com License #10401267109 Listed on: 11/25/2025

Property Details
Home Type
- Condominium
Est. Annual Taxes
- $12,272
Year Built
- Built in 2002
HOA Fees
- $1,262 Monthly HOA Fees
Parking
- Private Parking
Home Design
- Entry on the 1st floor
- Brick Exterior Construction
Interior Spaces
- 2,109 Sq Ft Home
- Storage
- Wood Flooring
- Finished Basement
Kitchen
- Oven
- Microwave
- Dishwasher
- Granite Countertops
Bedrooms and Bathrooms
- 3 Bedrooms
- Main Floor Bedroom
- Walk-In Closet
- 4 Full Bathrooms
Laundry
- Dryer
- Washer
Schools
- Ps 102 Bayview Elementary School
- Is 187 Christa Mcauliffe School (The Middle School
- Fort Hamilton High School
Utilities
- Cooling System Mounted To A Wall/Window
- Heating Available
Community Details
- Association fees include exterior maintenance, sewer, snow removal, trash, water
Listing and Financial Details
- Assessor Parcel Number 05868-1211
Map
Home Values in the Area
Average Home Value in this Area
Tax History
| Year | Tax Paid | Tax Assessment Tax Assessment Total Assessment is a certain percentage of the fair market value that is determined by local assessors to be the total taxable value of land and additions on the property. | Land | Improvement |
|---|---|---|---|---|
| 2026 | $12,727 | $103,849 | $13,197 | $90,652 |
| 2025 | $12,198 | $101,819 | $13,197 | $88,622 |
| 2024 | $12,198 | $97,570 | $13,197 | $84,373 |
| 2023 | $11,762 | $121,709 | $13,197 | $108,512 |
| 2022 | $11,589 | $119,716 | $13,197 | $106,519 |
| 2021 | $10,316 | $101,932 | $13,197 | $88,735 |
| 2020 | $5,585 | $117,535 | $13,197 | $104,338 |
| 2019 | $13,393 | $120,205 | $13,197 | $107,008 |
| 2018 | $10,170 | $114,678 | $13,197 | $101,481 |
| 2017 | $7,445 | $118,250 | $13,197 | $105,053 |
| 2016 | $4,985 | $103,887 | $13,197 | $90,690 |
| 2015 | $518 | $87,193 | $14,674 | $72,519 |
| 2014 | $518 | $82,568 | $13,197 | $69,371 |
Property History
| Date | Event | Price | List to Sale | Price per Sq Ft |
|---|---|---|---|---|
| 04/23/2026 04/23/26 | Price Changed | $1,344,999 | -2.9% | $638 / Sq Ft |
| 03/09/2026 03/09/26 | Price Changed | $1,384,999 | -1.1% | $657 / Sq Ft |
| 11/25/2025 11/25/25 | For Sale | $1,399,999 | -- | $664 / Sq Ft |
Purchase History
We collect this data history from publicly available records. To have your information removed, we recommend requesting removal directly through your county’s website.
| Date | Type | Sale Price | Title Company |
|---|---|---|---|
| Deed | $720,000 | -- | |
| Deed | $720,000 | -- | |
| Deed | $670,000 | -- | |
| Deed | $670,000 | -- | |
| Deed | $540,000 | -- | |
| Deed | $540,000 | -- |
Mortgage History
We collect this data history from publicly available records. To have your information removed, we recommend requesting removal directly through your county’s website.
| Date | Status | Loan Amount | Loan Type |
|---|---|---|---|
| Open | $576,000 | New Conventional | |
| Closed | $576,000 | New Conventional | |
| Previous Owner | $67,000 | No Value Available | |
| Previous Owner | $536,000 | Purchase Money Mortgage | |
| Closed | $0 | No Value Available |
Source: OneKey® MLS
MLS Number: 938328
APN: 05868-1211
Disclaimer: Certain information contained herein is derived from information provided by parties other than Homes.com. All information provided is deemed reliable, but is not guaranteed to be accurate and should be independently verified.
![]() The data relating to real estate for sale or lease on this web site comes in part from OneKey® MLS. Real estate listings held by brokerage firms other than Ten-X are marked with the OneKey® MLS logo or an abbreviated logo and detailed information about them includes the name of the listing broker.
The data relating to real estate for sale or lease on this web site comes in part from OneKey® MLS. Real estate listings held by brokerage firms other than Ten-X are marked with the OneKey® MLS logo or an abbreviated logo and detailed information about them includes the name of the listing broker.
Based on information submitted to the MLS GRID. All data is obtained from various sources and may not have been verified by broker or MLS GRID. Supplied Open House Information is subject to change without notice. All information should be independently reviewed and verified for accuracy. Properties may or may not be listed by the office/agent presenting the information. Some IDX listings have been excluded from this website. IDX information is provided exclusively for personal, non-commercial use, and may not be used for any purpose other than to identify prospective properties consumers may be interested in purchasing.
Information is deemed reliable but not guaranteed.
Copyright 2026 OneKey® MLS. All rights reserved.
Based on information submitted to the MLS GRID
Listings courtesy of OneKey® MLS as distributed by MLS GRID
- 33 E 70th St Unit 6F
- 33 E 70th St Unit 5E
- 6801 Shore Rd Unit 2N
- 6801 Shore Rd Unit 2T
- 7101 Shore Rd Unit 2C
- 7261 Shore Rd Unit 5T
- 7001 Louise Terrace
- 91 72nd St
- 7259 Shore Rd Unit 5-A
- 7259 Shore Rd Unit 3A
- 7259 Shore Rd Unit 6L
- 7259 Shore Rd Unit 5K
- 7259 Shore Rd Unit 5H
- 95 73rd St
- 74 73rd St
- 97 73rd St
- 7401 Shore Rd Unit 3-L
- 7401 Shore Rd Unit 2A
- 7401 Shore Rd Unit 1E
- 6807 Bay Cliff Terrace
- 6817 Owls Head Ct Unit 1B
- 6811 Owls Head Ct Unit 2-A
- 6806 Bliss Terrace Unit TH
- 7209 Narrows Ave Unit 2F
- 122 67th St Unit Ground Floor
- 145 72nd St Unit E4
- 180 Bay Ridge Ave
- 65 Bay Ridge Pkwy Unit 2
- 175 72nd St Unit 2
- 14 Bay Ridge Place
- 205-276 76th St Unit 2
- 273 76th St Unit 1
- 273 76th St Unit TOP
- 7624 3rd Ave
- 6020 3rd Ave
- 7910 4th Ave Unit 5R
- 532 72nd St
- 334 83rd St Unit 1
- 8314 4th Ave
- 7302 6th Ave
Ask me questions while you tour the home.