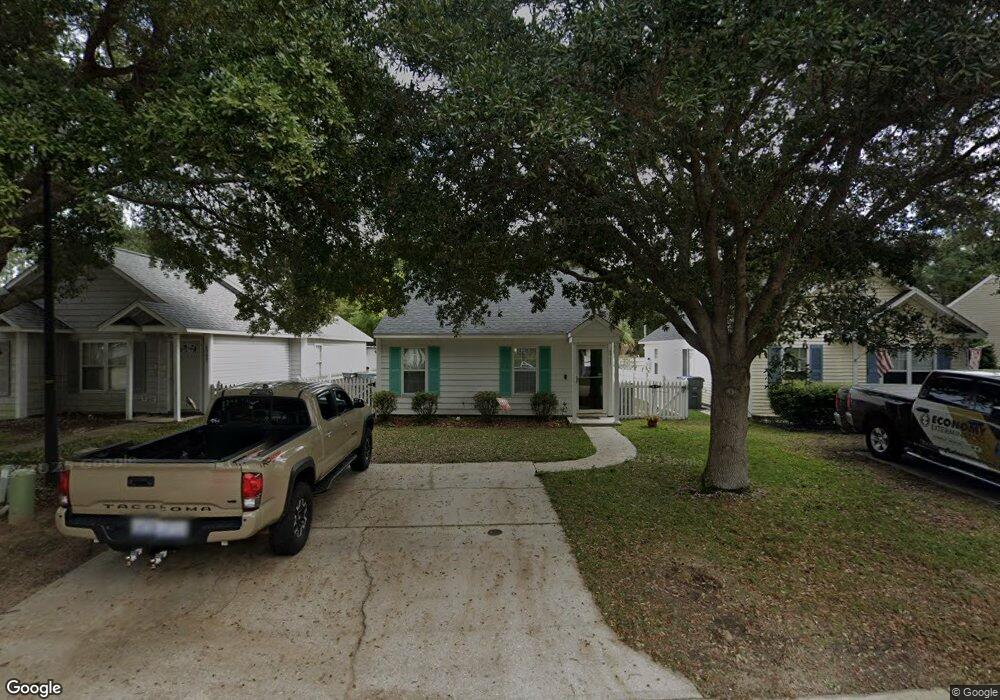
6911 Southern Exposure Wilmington, NC 28412
Lords Creek NeighborhoodEstimated Value: $260,000 - $311,000
2
Beds
2
Baths
864
Sq Ft
$333/Sq Ft
Est. Value
About This Home
This home is located at 6911 Southern Exposure, Wilmington, NC 28412 and is currently estimated at $287,319, approximately $332 per square foot. 6911 Southern Exposure is a home located in New Hanover County with nearby schools including Edwin A. Anderson Elementary School, Charles P. Murray Middle School, and Eugene Ashley High School.
Ownership History
Date
Name
Owned For
Owner Type
Purchase Details
Closed on
Mar 29, 2006
Sold by
White Sandy L
Bought by
Wilson Tanya C
Current Estimated Value
Home Financials for this Owner
Home Financials are based on the most recent Mortgage that was taken out on this home.
Original Mortgage
$23,400
Outstanding Balance
$13,287
Interest Rate
6.25%
Mortgage Type
Purchase Money Mortgage
Estimated Equity
$274,032
Purchase Details
Closed on
Mar 8, 2004
Sold by
Causey Sandra J
Bought by
White Sandy Leon
Purchase Details
Closed on
Aug 28, 1997
Sold by
Casco Crafters Inc
Bought by
Sanco Of Wilminton Serv Corp
Purchase Details
Closed on
Sep 26, 1996
Sold by
Sanco Of Wilmington Serv Corp
Bought by
Causey Sandra J
Purchase Details
Closed on
Jul 17, 1996
Sold by
Casco Crafters Inc
Bought by
Sanco Of Wilmington Serv Corp
Purchase Details
Closed on
May 16, 1996
Sold by
Sanders Nathan S Judia B
Bought by
Casco Crafters Inc
Create a Home Valuation Report for This Property
The Home Valuation Report is an in-depth analysis detailing your home's value as well as a comparison with similar homes in the area
Home Values in the Area
Average Home Value in this Area
Purchase History
| Date | Buyer | Sale Price | Title Company |
|---|---|---|---|
| Wilson Tanya C | -- | None Available | |
| White Sandy Leon | $85,500 | -- | |
| Sanco Of Wilminton Serv Corp | -- | -- | |
| Casco Crafters Inc | -- | -- | |
| Causey Sandra J | $75,500 | -- | |
| Sanco Of Wilmington Serv Corp | $405,000 | -- | |
| Casco Crafters Inc | -- | -- |
Source: Public Records
Mortgage History
| Date | Status | Borrower | Loan Amount |
|---|---|---|---|
| Open | Wilson Tanya C | $23,400 |
Source: Public Records
Tax History Compared to Growth
Tax History
| Year | Tax Paid | Tax Assessment Tax Assessment Total Assessment is a certain percentage of the fair market value that is determined by local assessors to be the total taxable value of land and additions on the property. | Land | Improvement |
|---|---|---|---|---|
| 2025 | $1,049 | $257,600 | $99,300 | $158,300 |
| 2023 | $985 | $174,400 | $67,700 | $106,700 |
| 2022 | $988 | $174,400 | $67,700 | $106,700 |
| 2021 | $967 | $174,400 | $67,700 | $106,700 |
| 2020 | $742 | $117,300 | $38,000 | $79,300 |
| 2019 | $732 | $115,800 | $38,000 | $77,800 |
| 2018 | $732 | $115,800 | $38,000 | $77,800 |
| 2017 | $750 | $115,800 | $38,000 | $77,800 |
| 2016 | $662 | $95,500 | $35,000 | $60,500 |
| 2015 | $615 | $95,500 | $35,000 | $60,500 |
| 2014 | $605 | $95,500 | $35,000 | $60,500 |
Source: Public Records
Map
Nearby Homes
- 128 Lehigh Rd
- 8005 Sweetgrass Ct Unit 5
- 1113 Tidalwalk Dr
- 1220 Tidalwalk Dr
- 7171 Carolina Beach Rd Shoreline 17
- 7171
- 7171 Carolina Beach Rd Shoreline 20
- 7171 Carolina Beach Rd Shoreline 3
- 7171 Carolina Beach Rd Shoreline 57
- 7171 Carolina Beach Rd Shoreline 62
- 7171 Carolina Beach Rd Shoreline 22
- 7171 Carolina Beach Rd Shoreline 10
- 7171 Carolina Beach Rd Shoreline 13
- 7171 Carolina Beach Rd Shoreline 46
- 7171 Carolina Beach Rd Shoreline 15
- 7171 Carolina Beach Rd Shoreline 40
- 7171 Carolina Beach Rd Shoreline 28
- 7171 Carolina Beach Rd Shoreline 8
- 7171 Carolina Beach Rd Shoreline 25
- 7171 Carolina Beach Rd Shoreline 5
- 6909 Southern Exposure
- 6913 Southern Exposure
- 6915 Southern Exposure
- 6907 Southern Exposure
- 6917 Southern Exposure
- 6905 Southern Exposure
- 6912 Southern Exposure
- 6910 Southern Exposure
- 6919 Southern Exposure
- 6908 Southern Exposure
- 6903 Southern Exposure
- 6906 Southern Exposure
- 6916 Southern Exposure
- 6921 Southern Exposure
- 6901 Southern Exposure
- 825 Summertree Ln
- 6918 Southern Exposure
- 6904 Southern Exposure
- 6923 Southern Exposure
- 6920 Southern Exposure