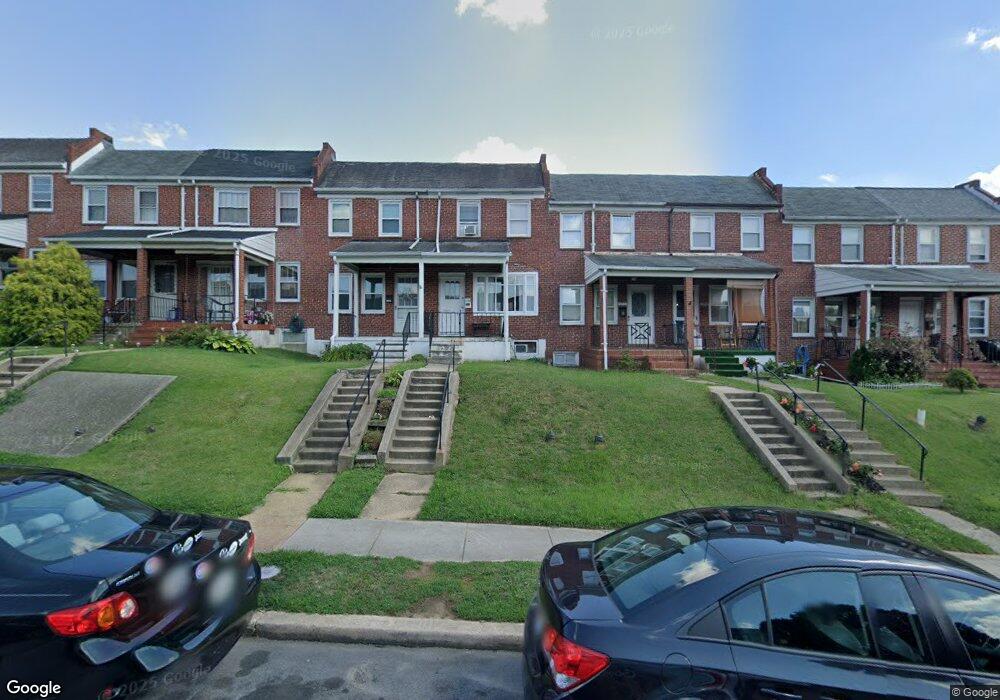
6913 Gough St Baltimore, MD 21224
Estimated Value: $131,611 - $163,000
Studio
1
Bath
784
Sq Ft
$188/Sq Ft
Est. Value
About This Home
This home is located at 6913 Gough St, Baltimore, MD 21224 and is currently estimated at $147,306, approximately $187 per square foot. 6913 Gough St is a home located in Baltimore City with nearby schools including Graceland Park-O'Donnell Heights Elementary/Middle School, Booker T. Washington Middle School, and Patterson High School.
Ownership History
Date
Name
Owned For
Owner Type
Purchase Details
Closed on
Jul 31, 2006
Sold by
Rallo John J
Bought by
Hatzinicolas Nicholas
Current Estimated Value
Home Financials for this Owner
Home Financials are based on the most recent Mortgage that was taken out on this home.
Original Mortgage
$100,000
Outstanding Balance
$58,904
Interest Rate
6.7%
Mortgage Type
Purchase Money Mortgage
Estimated Equity
$88,402
Create a Home Valuation Report for This Property
The Home Valuation Report is an in-depth analysis detailing your home's value as well as a comparison with similar homes in the area
Purchase History
| Date | Buyer | Sale Price | Title Company |
|---|---|---|---|
| Hatzinicolas Nicholas | $125,000 | -- |
Source: Public Records
Mortgage History
| Date | Status | Borrower | Loan Amount |
|---|---|---|---|
| Open | Hatzinicolas Nicholas | $100,000 | |
| Closed | Hatzinicolas Nicholas | $25,000 |
Source: Public Records
Tax History
| Year | Tax Paid | Tax Assessment Tax Assessment Total Assessment is a certain percentage of the fair market value that is determined by local assessors to be the total taxable value of land and additions on the property. | Land | Improvement |
|---|---|---|---|---|
| 2025 | $2,324 | $106,800 | $25,000 | $81,800 |
| 2024 | $2,324 | $98,933 | -- | -- |
| 2023 | $2,149 | $91,067 | $0 | $0 |
| 2022 | $1,964 | $83,200 | $25,000 | $58,200 |
| 2021 | $1,964 | $83,200 | $25,000 | $58,200 |
| 2020 | $1,799 | $83,200 | $25,000 | $58,200 |
| 2019 | $1,845 | $85,900 | $25,000 | $60,900 |
| 2018 | $1,858 | $85,200 | $0 | $0 |
| 2017 | $1,861 | $84,500 | $0 | $0 |
| 2016 | $1,856 | $83,800 | $0 | $0 |
| 2015 | $1,856 | $83,800 | $0 | $0 |
| 2014 | $1,856 | $83,800 | $0 | $0 |
Source: Public Records
Map
Nearby Homes
Your Personal Tour Guide
Ask me questions while you tour the home.