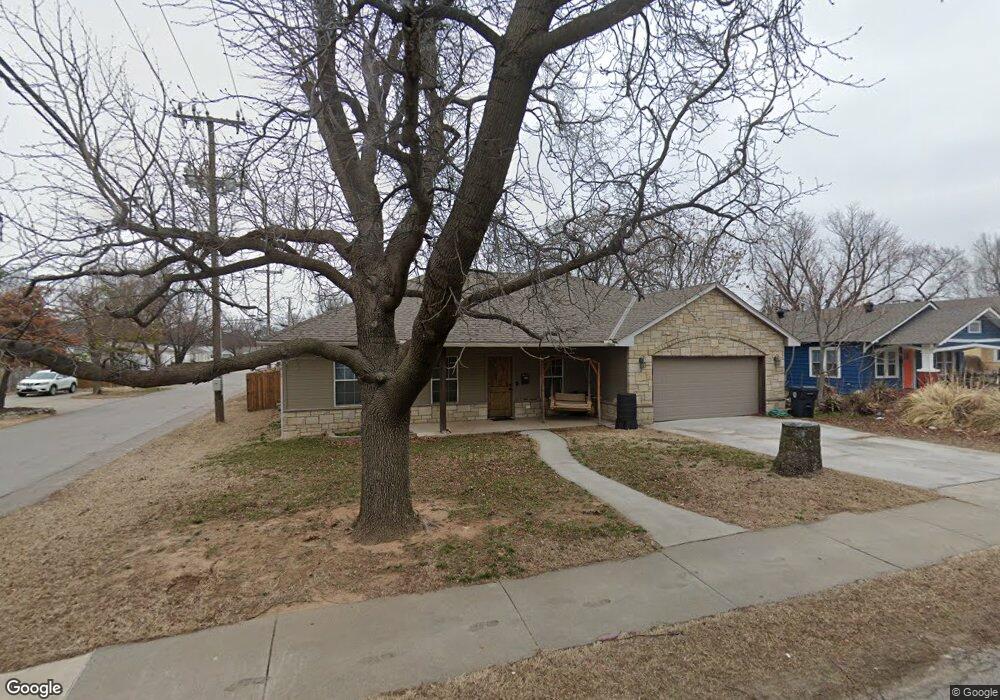
6913 NW 42nd St Bethany, OK 73008
Estimated Value: $265,000 - $292,405
3
Beds
2
Baths
1,916
Sq Ft
$145/Sq Ft
Est. Value
About This Home
This home is located at 6913 NW 42nd St, Bethany, OK 73008 and is currently estimated at $278,601, approximately $145 per square foot. 6913 NW 42nd St is a home located in Oklahoma County with nearby schools including Earl Harris Elementary School, Bethany Middle School, and St Charles Borromeo Catholic School.
Ownership History
Date
Name
Owned For
Owner Type
Purchase Details
Closed on
Jan 27, 2023
Sold by
Wright Jaime L
Bought by
Eiler Elijah J and Wright Jaime L
Current Estimated Value
Purchase Details
Closed on
Oct 26, 2012
Sold by
Hodge James A and Hodge Jamey A
Bought by
Wright Edward B and Wright Jaime L
Purchase Details
Closed on
Sep 12, 2011
Sold by
Brandt Phillip Ronald and Brandt Elicia Lynn
Bought by
Hodge James A and Hodge Jamey A
Purchase Details
Closed on
Oct 21, 1999
Sold by
Peters Dorle M and The Dorle M Peters Living Trus
Bought by
Brandt Phillip Ronald and Brandt Elicia Lynn
Home Financials for this Owner
Home Financials are based on the most recent Mortgage that was taken out on this home.
Original Mortgage
$45,143
Interest Rate
7.9%
Mortgage Type
FHA
Purchase Details
Closed on
May 19, 1999
Sold by
W Peters
Bought by
Peters Dorle M
Create a Home Valuation Report for This Property
The Home Valuation Report is an in-depth analysis detailing your home's value as well as a comparison with similar homes in the area
Home Values in the Area
Average Home Value in this Area
Purchase History
| Date | Buyer | Sale Price | Title Company |
|---|---|---|---|
| Eiler Elijah J | -- | -- | |
| Wright Edward B | $179,000 | -- | |
| Hodge James A | $43,000 | Old Republic Title Company O | |
| Brandt Phillip Ronald | $45,000 | -- | |
| Peters Dorle M | -- | American Guaranty Title Co |
Source: Public Records
Mortgage History
| Date | Status | Borrower | Loan Amount |
|---|---|---|---|
| Previous Owner | Brandt Phillip Ronald | $45,143 | |
| Closed | Brandt Phillip Ronald | $1,805 |
Source: Public Records
Tax History Compared to Growth
Tax History
| Year | Tax Paid | Tax Assessment Tax Assessment Total Assessment is a certain percentage of the fair market value that is determined by local assessors to be the total taxable value of land and additions on the property. | Land | Improvement |
|---|---|---|---|---|
| 2024 | -- | $29,398 | $4,602 | $24,796 |
| 2023 | $0 | $28,542 | $3,276 | $25,266 |
| 2022 | $3,325 | $27,710 | $3,597 | $24,113 |
| 2021 | $3,157 | $26,391 | $3,975 | $22,416 |
| 2020 | $3,211 | $25,135 | $4,083 | $21,052 |
| 2019 | $2,914 | $23,958 | $3,207 | $20,751 |
| 2018 | $2,794 | $22,818 | $0 | $0 |
| 2017 | $2,715 | $21,730 | $3,091 | $18,639 |
| 2016 | $2,608 | $20,696 | $2,987 | $17,709 |
| 2015 | $2,354 | $19,710 | $2,681 | $17,029 |
| 2014 | $2,316 | $19,492 | $2,681 | $16,811 |
Source: Public Records
Map
Nearby Homes
- 6906 NW 43rd St
- 6811 NW 43rd St
- 7014 NW 44th St
- 4601 N Rockwell Ave
- 7000 NW 48th St
- 4808 N Willow Ave
- 4508 N College Ave
- 3817 N Asbury Ave
- 7221 NW 46th St
- 7004 NW 50th St
- 4507 N Donald Ave
- 4908 N Central Rd
- 4604 N Donald Ave
- 6908 NW 36th St
- 6800 NW 36th St
- 3707 Franks Way
- 4602 N Redmond Ave
- 5202 N Rockwell Ave
- 4400 N Wheeler Ave
- 3720 N Peniel Ave
- 6909 NW 42nd St
- 7001 NW 42nd St
- 4304 N Beaver Ave
- 6907 NW 42nd St
- 4306 N Beaver Ave
- 7003 NW 42nd St
- 4305 N Beaver Ave
- 6910 NW 42nd St
- 4308 N Beaver Ave
- 6903 NW 42nd St
- 4307 N Beaver Ave
- 4213 N Beaver Ave
- 7005 NW 42nd St
- 4310 N Beaver Ave
- 6906 NW 42nd St
- 4309 N Beaver Ave
- 4211 N Beaver Ave
- 6908 NW 42nd St
- 6908 NW 42nd St Unit 1/2 Up
- 6908 NW 42nd St Unit 1/2 Down