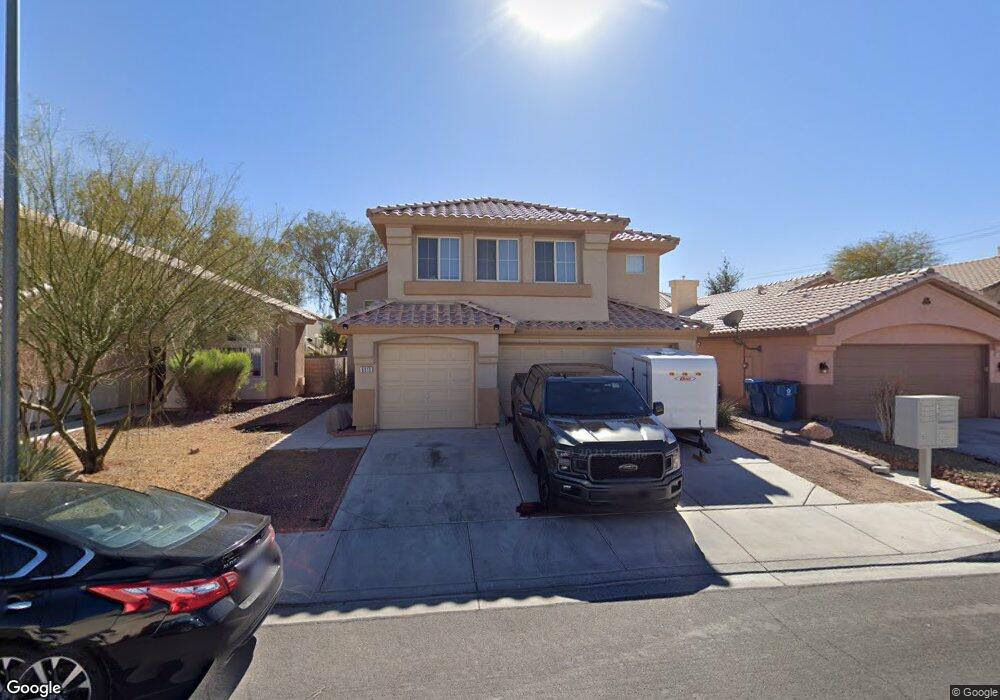
6913 Squaw Mnt Dr Unit 202 Las Vegas, NV 89130
Estimated Value: $262,723 - $280,000
2
Beds
2
Baths
1,189
Sq Ft
$231/Sq Ft
Est. Value
About This Home
This home is located at 6913 Squaw Mnt Dr Unit 202, Las Vegas, NV 89130 and is currently estimated at $274,681, approximately $231 per square foot. 6913 Squaw Mnt Dr Unit 202 is a home located in Clark County with nearby schools including Ernest May Elementary School, Theron L Swainston Middle School, and Shadow Ridge High School.
Ownership History
Date
Name
Owned For
Owner Type
Purchase Details
Closed on
Aug 16, 2022
Sold by
Biera Julie
Bought by
Godbee Bland Sharon
Current Estimated Value
Home Financials for this Owner
Home Financials are based on the most recent Mortgage that was taken out on this home.
Original Mortgage
$248,907
Outstanding Balance
$237,565
Interest Rate
5.3%
Mortgage Type
FHA
Estimated Equity
$37,116
Purchase Details
Closed on
Jun 5, 2019
Sold by
Ajamian George and Ajamian Therese
Bought by
Biera Julie
Home Financials for this Owner
Home Financials are based on the most recent Mortgage that was taken out on this home.
Original Mortgage
$129,600
Interest Rate
4.1%
Mortgage Type
New Conventional
Purchase Details
Closed on
Aug 4, 2017
Sold by
Dzul Group Llc
Bought by
Ajamian George and Ajamian Therese
Home Financials for this Owner
Home Financials are based on the most recent Mortgage that was taken out on this home.
Original Mortgage
$121,600
Interest Rate
3.9%
Mortgage Type
New Conventional
Purchase Details
Closed on
Jun 1, 2017
Sold by
Kornegay Jeanne A
Bought by
Dzul Group Llc
Purchase Details
Closed on
Oct 23, 2009
Sold by
Fannie Mae
Bought by
Kornegay Jeanne A
Home Financials for this Owner
Home Financials are based on the most recent Mortgage that was taken out on this home.
Original Mortgage
$65,786
Interest Rate
5.05%
Mortgage Type
FHA
Purchase Details
Closed on
Jun 29, 2009
Sold by
Knight Joel B and Knight Lisa A
Bought by
Federal National Mortgage Association
Purchase Details
Closed on
Apr 27, 2004
Sold by
Nye Kirk R
Bought by
Knight Joel B and Knight Lisa A
Home Financials for this Owner
Home Financials are based on the most recent Mortgage that was taken out on this home.
Original Mortgage
$136,950
Interest Rate
5.75%
Mortgage Type
Unknown
Purchase Details
Closed on
Aug 15, 2003
Sold by
Benson Janyce
Bought by
Nye Kirk R
Home Financials for this Owner
Home Financials are based on the most recent Mortgage that was taken out on this home.
Original Mortgage
$84,800
Interest Rate
5.37%
Mortgage Type
Unknown
Purchase Details
Closed on
Sep 11, 1997
Sold by
Pueblo Llc
Bought by
Benson Janyce
Home Financials for this Owner
Home Financials are based on the most recent Mortgage that was taken out on this home.
Original Mortgage
$91,650
Interest Rate
7.34%
Mortgage Type
FHA
Create a Home Valuation Report for This Property
The Home Valuation Report is an in-depth analysis detailing your home's value as well as a comparison with similar homes in the area
Home Values in the Area
Average Home Value in this Area
Purchase History
| Date | Buyer | Sale Price | Title Company |
|---|---|---|---|
| Godbee Bland Sharon | $253,500 | First American Title | |
| Biera Julie | $162,000 | Chicago Title Corporate C | |
| Ajamian George | $128,000 | Lawyers Title Of Nevada | |
| Dzul Group Llc | $111,400 | None Available | |
| Kornegay Jeanne A | $67,000 | Old Republic Title Company O | |
| Federal National Mortgage Association | $136,054 | Fidelity National Default So | |
| Knight Joel B | $171,200 | Ticor Title | |
| Nye Kirk R | $106,000 | Land Title Of Nevada | |
| Benson Janyce | $95,000 | Nevada Title Company |
Source: Public Records
Mortgage History
| Date | Status | Borrower | Loan Amount |
|---|---|---|---|
| Open | Godbee Bland Sharon | $248,907 | |
| Previous Owner | Biera Julie | $129,600 | |
| Previous Owner | Ajamian George | $121,600 | |
| Previous Owner | Kornegay Jeanne A | $65,786 | |
| Previous Owner | Knight Joel B | $136,950 | |
| Previous Owner | Nye Kirk R | $84,800 | |
| Previous Owner | Benson Janyce | $91,650 | |
| Closed | Knight Joel B | $17,100 |
Source: Public Records
Tax History Compared to Growth
Tax History
| Year | Tax Paid | Tax Assessment Tax Assessment Total Assessment is a certain percentage of the fair market value that is determined by local assessors to be the total taxable value of land and additions on the property. | Land | Improvement |
|---|---|---|---|---|
| 2025 | $1,040 | $58,476 | $21,700 | $36,776 |
| 2024 | $963 | $58,476 | $21,700 | $36,776 |
| 2023 | $963 | $59,903 | $25,900 | $34,003 |
| 2022 | $892 | $50,089 | $18,550 | $31,539 |
| 2021 | $826 | $48,277 | $17,850 | $30,427 |
| 2020 | $764 | $46,693 | $16,800 | $29,893 |
| 2019 | $704 | $44,823 | $15,050 | $29,773 |
| 2018 | $684 | $37,810 | $8,750 | $29,060 |
| 2017 | $1,203 | $36,696 | $7,000 | $29,696 |
| 2016 | $649 | $27,468 | $5,250 | $22,218 |
| 2015 | $646 | $21,785 | $3,850 | $17,935 |
| 2014 | $627 | $18,562 | $5,250 | $13,312 |
Source: Public Records
Map
Nearby Homes
- 6904 Indian Chief Dr Unit 201
- 6808 Indian Chief Dr Unit 204
- 6704 Indian Chief Dr Unit 101
- 6705 Squaw Mountain Dr Unit 102
- 6701 Squaw Mountain Dr Unit 201
- 5116 Jordan Frey St Unit 201
- 28460 U S Route 95
- 5024 Saint Annes Dr
- 5144 Forest Oaks Dr
- 6513 Echo Crest Ave
- 5009 Forest Oaks Dr
- 5152 Forest Oaks Dr
- 5041 Portraits Place
- 5409 Flora Spray St
- 7208 Painted Shadows Way
- 6540 W Hammer Ln
- 4901 Portraits Place
- 6507 Dove Point Place
- 6613 Sand Bench Ave
- 4920 Black Bear Rd Unit 204
- 6913 Squaw Mnt Dr Unit 203
- 6913 Squaw Mnt Dr Unit 204
- 6913 Squaw Mnt Dr Unit 101
- 6913 Squaw Mnt Dr Unit 102
- 6913 Squaw Mnt Dr Unit 201
- 6913 Squaw Mountain Dr Unit 204
- 6913 Squaw Mountain Dr Unit 203
- 6913 Squaw Mountain Dr Unit 201
- 6913 Squaw Mountain Dr Unit 101
- 6913 Squaw Mountain Dr Unit 102
- 6913 Squaw Mountain Dr Unit 202
- 5116 Harvest Time St Unit 204
- 5116 Harvest Time St Unit 101
- 5116 Harvest Time St Unit 203
- 5116 Harvest Time St Unit 102
- 5116 Harvest Time St Unit 201
- 5116 Harvest Time St Unit 202
- 6909 Squaw Mountain Dr Unit 203
- 6909 Squaw Mountain Dr Unit 201
- 6909 Squaw Mountain Dr Unit 202