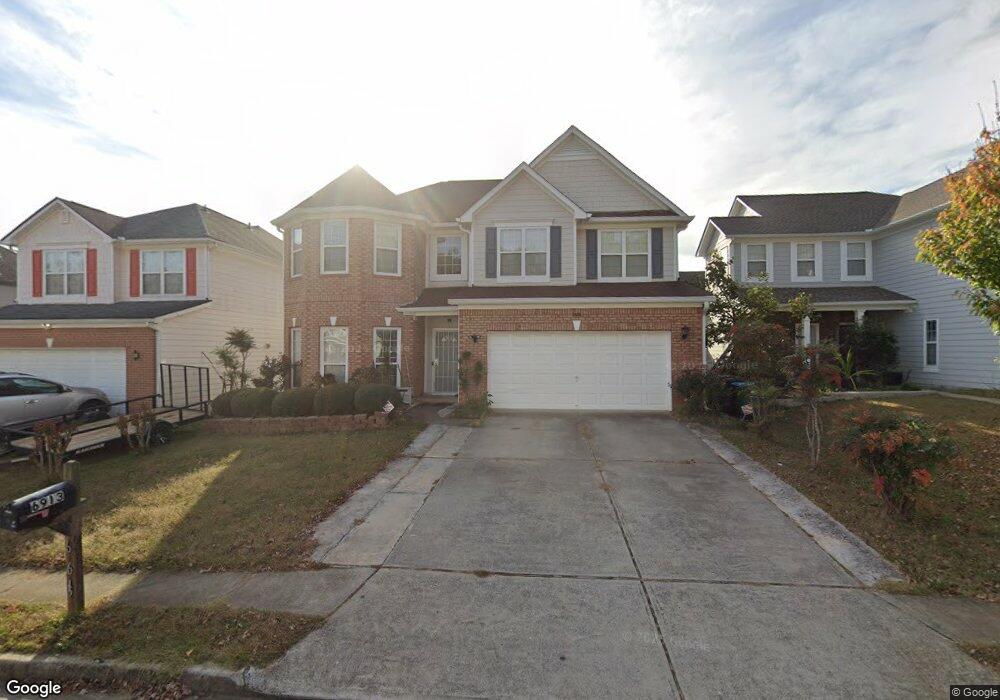
6913 Wandering Way Norcross, GA 30093
Pittsburg NeighborhoodEstimated Value: $446,000 - $496,000
4
Beds
3
Baths
2,660
Sq Ft
$174/Sq Ft
Est. Value
About This Home
This home is located at 6913 Wandering Way, Norcross, GA 30093 and is currently estimated at $462,953, approximately $174 per square foot. 6913 Wandering Way is a home located in Gwinnett County with nearby schools including Nesbit Elementary School, Lilburn Middle School, and Meadowcreek High School.
Ownership History
Date
Name
Owned For
Owner Type
Purchase Details
Closed on
Apr 23, 2019
Sold by
Nguyen Anh Thi
Bought by
Bui Dieu D and Nguyen Vy Thi Tuong
Current Estimated Value
Home Financials for this Owner
Home Financials are based on the most recent Mortgage that was taken out on this home.
Original Mortgage
$210,000
Outstanding Balance
$167,393
Interest Rate
0.55%
Mortgage Type
New Conventional
Estimated Equity
$295,560
Purchase Details
Closed on
Aug 15, 2007
Sold by
Nguyen Anh T
Bought by
Nguyen Anh T and Vanle Duyet
Home Financials for this Owner
Home Financials are based on the most recent Mortgage that was taken out on this home.
Original Mortgage
$125,000
Interest Rate
6.56%
Mortgage Type
New Conventional
Purchase Details
Closed on
Jun 22, 2001
Sold by
Ryland Group Inc
Bought by
Chaganthi Madhusudan R
Home Financials for this Owner
Home Financials are based on the most recent Mortgage that was taken out on this home.
Original Mortgage
$192,750
Interest Rate
7.14%
Mortgage Type
New Conventional
Create a Home Valuation Report for This Property
The Home Valuation Report is an in-depth analysis detailing your home's value as well as a comparison with similar homes in the area
Home Values in the Area
Average Home Value in this Area
Purchase History
| Date | Buyer | Sale Price | Title Company |
|---|---|---|---|
| Bui Dieu D | $300,000 | -- | |
| Nguyen Anh T | $225,000 | -- | |
| Nguyen Anh T | $225,000 | -- | |
| Chaganthi Madhusudan R | $203,000 | -- |
Source: Public Records
Mortgage History
| Date | Status | Borrower | Loan Amount |
|---|---|---|---|
| Open | Bui Dieu D | $210,000 | |
| Previous Owner | Nguyen Anh T | $125,000 | |
| Previous Owner | Chaganthi Madhusudan R | $192,750 |
Source: Public Records
Tax History Compared to Growth
Tax History
| Year | Tax Paid | Tax Assessment Tax Assessment Total Assessment is a certain percentage of the fair market value that is determined by local assessors to be the total taxable value of land and additions on the property. | Land | Improvement |
|---|---|---|---|---|
| 2025 | $7,107 | $192,520 | $24,000 | $168,520 |
| 2024 | $7,240 | $194,120 | $24,000 | $170,120 |
| 2023 | $7,240 | $166,560 | $24,400 | $142,160 |
| 2022 | $6,230 | $166,560 | $24,400 | $142,160 |
| 2021 | $4,861 | $125,920 | $24,400 | $101,520 |
| 2020 | $4,312 | $110,000 | $20,000 | $90,000 |
| 2019 | $3,592 | $110,000 | $20,000 | $90,000 |
| 2018 | $3,359 | $99,080 | $20,000 | $79,080 |
| 2016 | $2,784 | $76,160 | $13,200 | $62,960 |
| 2015 | $2,529 | $68,160 | $11,200 | $56,960 |
| 2014 | -- | $68,160 | $11,200 | $56,960 |
Source: Public Records
Map
Nearby Homes
- 6043 Rolling Way
- 6064 Wandering Way Unit 1
- 6118 Queen Anne Ct
- 561 Pebble Creek Dr
- 6499 Panasa Ct
- 6090 Wintergreen Rd Unit 1A3
- 6090 Wintergreen Rd
- 6390 Wedgeview Dr
- 6043 Wintergreen Rd Unit 4J2
- 5950 Wintergreen Rd
- 5970 Wintergreen Rd
- 6341 Wedgeview Dr
- 5969 Wintergreen Rd
- 6009 Mark Trail Unit 2
- 478 Commons Park Ln
- 6366 Jasper Ct
- 1034 Redwood Dr
- 6355 Wedgeview Ct
- 6353 Wedgeview Ct
- 903 Redwood Dr
- 6903 Wandering Way
- 6923 Wandering Way
- 6893 Wandering Way
- 6933 Wandering Way
- 757 Grey Rock Rd
- 767 Grey Rock Rd
- 747 Grey Rock Rd
- 777 Grey Rock Rd
- 6883 Wandering Way
- 737 Grey Rock Rd
- 6914 Wandering Way NW
- 6924 Wandering Way
- 6914 Wandering Way
- 6943 Wandering Way
- 6904 Wandering Way
- 6934 Wandering Way
- 787 Grey Rock Rd Unit 11
- 787 Grey Rock Rd
- 6894 Wandering Way
- 727 Grey Rock Rd