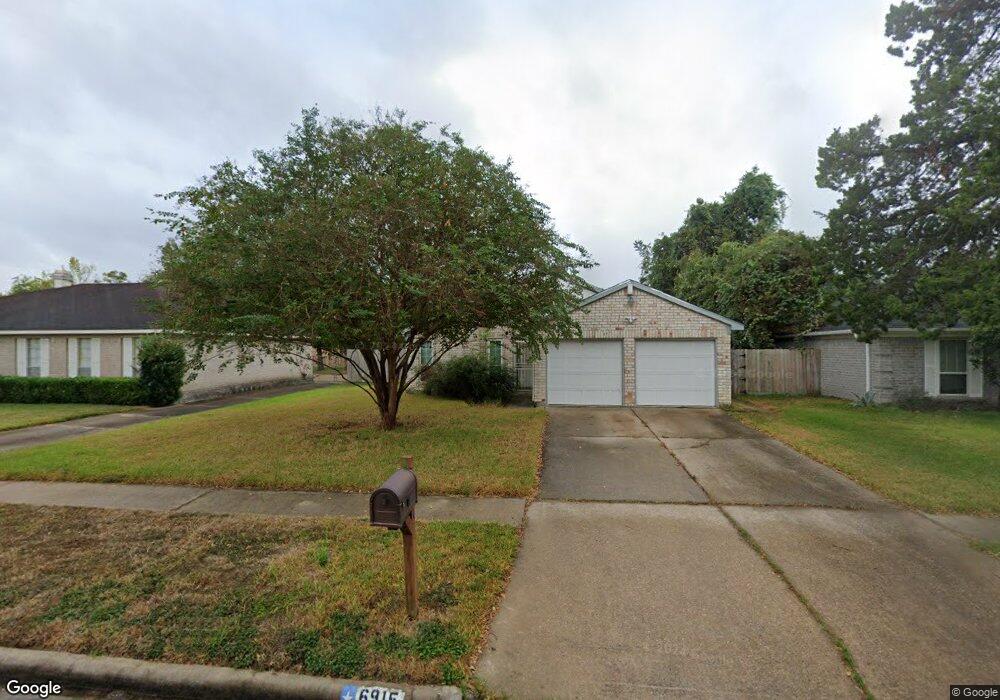
6915 Northleaf Dr Houston, TX 77086
North Houston NeighborhoodEstimated Value: $202,203 - $235,000
3
Beds
2
Baths
1,284
Sq Ft
$170/Sq Ft
Est. Value
About This Home
This home is located at 6915 Northleaf Dr, Houston, TX 77086 and is currently estimated at $218,551, approximately $170 per square foot. 6915 Northleaf Dr is a home located in Harris County with nearby schools including Kujawa EC/Pre-K/K School, Carmichael Elementary School, and Shotwell Middle School.
Ownership History
Date
Name
Owned For
Owner Type
Purchase Details
Closed on
Jul 17, 2019
Sold by
2004 Nw Park Development Inc
Bought by
Mhi Partnership Ltd
Current Estimated Value
Purchase Details
Closed on
Apr 26, 2019
Sold by
Nw Park Development Inc
Bought by
Mhi Partnership Ltd
Purchase Details
Closed on
Oct 6, 2015
Sold by
Baker Bryan C
Bought by
Dugan Mike
Purchase Details
Closed on
Oct 10, 2012
Sold by
Federal Home Loan Mortgage Corporation
Bought by
Baker Bryan C
Purchase Details
Closed on
May 1, 2012
Sold by
Dugan Michael E and Dugan Glenda Kay
Bought by
Federal Home Loans Mortgage Assn
Purchase Details
Closed on
Mar 2, 2007
Sold by
7168 Stone Brook I Ltd
Bought by
Gateway Homes Ltd
Create a Home Valuation Report for This Property
The Home Valuation Report is an in-depth analysis detailing your home's value as well as a comparison with similar homes in the area
Home Values in the Area
Average Home Value in this Area
Purchase History
| Date | Buyer | Sale Price | Title Company |
|---|---|---|---|
| Mhi Partnership Ltd | -- | None Available | |
| Mhi Partnership Ltd | -- | None Available | |
| Dugan Mike | -- | None Available | |
| Baker Bryan C | -- | None Available | |
| Federal Home Loans Mortgage Assn | $24,255 | None Available | |
| Gateway Homes Ltd | -- | None Available |
Source: Public Records
Mortgage History
| Date | Status | Borrower | Loan Amount |
|---|---|---|---|
| Closed | Mhi Partnership Ltd | $0 |
Source: Public Records
Tax History Compared to Growth
Tax History
| Year | Tax Paid | Tax Assessment Tax Assessment Total Assessment is a certain percentage of the fair market value that is determined by local assessors to be the total taxable value of land and additions on the property. | Land | Improvement |
|---|---|---|---|---|
| 2025 | $913 | $199,191 | $39,692 | $159,499 |
| 2024 | $913 | $202,091 | $39,692 | $162,399 |
| 2023 | $913 | $205,800 | $39,692 | $166,108 |
| 2022 | $3,885 | $173,408 | $33,638 | $139,770 |
| 2021 | $3,523 | $145,075 | $33,638 | $111,437 |
| 2020 | $3,715 | $137,608 | $33,638 | $103,970 |
| 2019 | $3,549 | $129,898 | $17,144 | $112,754 |
| 2018 | $662 | $123,163 | $17,144 | $106,019 |
| 2017 | $2,828 | $115,324 | $15,395 | $99,929 |
| 2016 | $2,571 | $104,633 | $15,395 | $89,238 |
| 2015 | $2,000 | $97,378 | $15,395 | $81,983 |
| 2014 | $2,000 | $73,810 | $15,395 | $58,415 |
Source: Public Records
Map
Nearby Homes
- 6654 Brownie Campbell Rd
- 6722 Winding Trace Dr
- 11007 Tobasa Ct
- 11006 Crinkleawn Dr
- 6630 Brownie Campbell Rd
- 7002 Sandswept Ln
- 6610 Northleaf Dr
- 11021 Crenchrus Ct
- 11009 Panicum Ct
- 7023 Sandswept Ln
- 7218 Winding Trace Dr
- 6615 Winding Trace Dr
- 7222 Northleaf Dr
- 10522 Northview Dr
- 6911 Silver Star Dr
- 7227 Greenyard Dr
- 10614 Mackenzie Dr
- 6502 Trail Valley Way
- 10711 Heather Hill Dr
- 10307 Bammel North Houston Rd
- 6911 Northleaf Dr
- 6919 Northleaf Dr
- 6907 Northleaf Dr
- 6923 Northleaf Dr
- 6914 Canyon Way Dr
- 6918 Canyon Way Dr
- 6922 Canyon Way Dr
- 6914 Northleaf Dr
- 6910 Canyon Way Dr
- 6927 Northleaf Dr
- 6910 Northleaf Dr
- 6903 Northleaf Dr
- 6918 Northleaf Dr
- 6906 Northleaf Dr
- 6922 Northleaf Dr
- 6926 Canyon Way Dr
- 10711 Misty Summit Dr
- 6931 Northleaf Dr
- 6902 Northleaf Dr
- 6926 Northleaf Dr