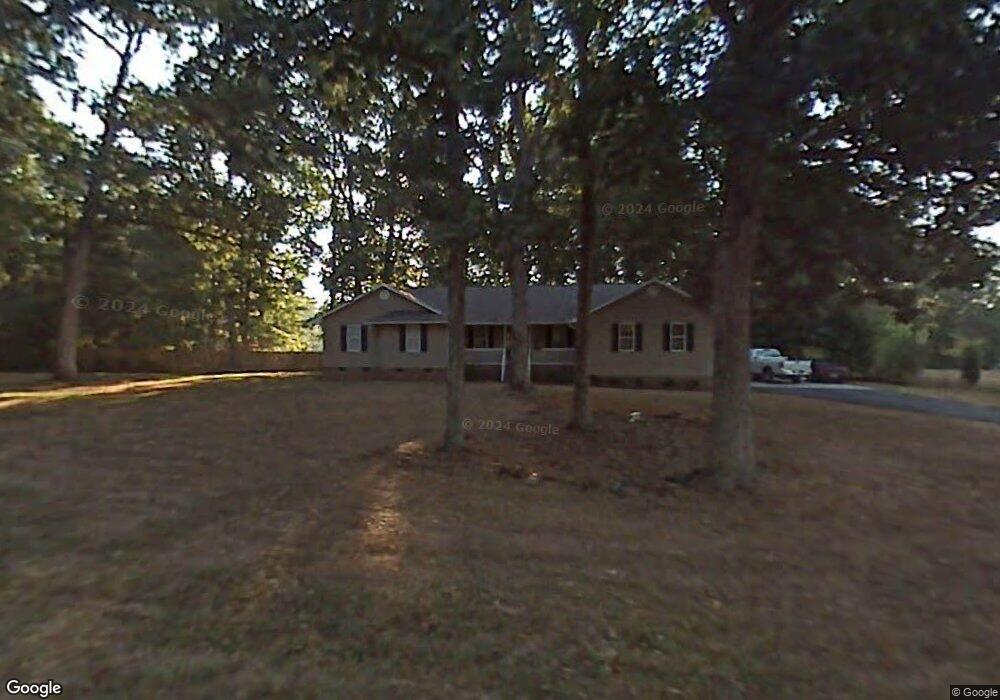
6918 Cedar Square Rd High Point, NC 27263
Estimated Value: $250,000 - $293,786
Studio
2
Baths
1,516
Sq Ft
$180/Sq Ft
Est. Value
About This Home
This home is located at 6918 Cedar Square Rd, High Point, NC 27263 and is currently estimated at $273,447, approximately $180 per square foot. 6918 Cedar Square Rd is a home located in Randolph County with nearby schools including John R. Lawrence Elementary School, Wheatmore Middle School, and Trinity High School.
Ownership History
Date
Name
Owned For
Owner Type
Purchase Details
Closed on
Jun 4, 2007
Sold by
The P D Group Llc
Bought by
Vanamburg Douglas C and Vanamburg Lori L
Current Estimated Value
Home Financials for this Owner
Home Financials are based on the most recent Mortgage that was taken out on this home.
Original Mortgage
$155,000
Outstanding Balance
$94,230
Interest Rate
6.16%
Mortgage Type
Purchase Money Mortgage
Estimated Equity
$179,217
Purchase Details
Closed on
Aug 30, 2006
Sold by
Deutsche Bank National Trust Co
Bought by
The P D Group Llc
Purchase Details
Closed on
Jul 3, 2006
Sold by
Lockhart Jefferson D and Lockhart Angela J
Bought by
Deutsche Bank National Trust Co
Purchase Details
Closed on
Jan 9, 1989
Bought by
Vanamburg Douglas C Vanamburg Lor
Create a Home Valuation Report for This Property
The Home Valuation Report is an in-depth analysis detailing your home's value as well as a comparison with similar homes in the area
Home Values in the Area
Average Home Value in this Area
Purchase History
| Date | Buyer | Sale Price | Title Company |
|---|---|---|---|
| Vanamburg Douglas C | $175,000 | None Available | |
| The P D Group Llc | $81,000 | None Available | |
| Deutsche Bank National Trust Co | $157,355 | None Available | |
| Vanamburg Douglas C Vanamburg Lor | -- | -- |
Source: Public Records
Mortgage History
| Date | Status | Borrower | Loan Amount |
|---|---|---|---|
| Open | Vanamburg Douglas C | $155,000 |
Source: Public Records
Tax History
| Year | Tax Paid | Tax Assessment Tax Assessment Total Assessment is a certain percentage of the fair market value that is determined by local assessors to be the total taxable value of land and additions on the property. | Land | Improvement |
|---|---|---|---|---|
| 2025 | $1,512 | $206,290 | $45,500 | $160,790 |
| 2024 | $1,491 | $206,290 | $45,500 | $160,790 |
| 2023 | $1,491 | $206,290 | $45,500 | $160,790 |
| 2022 | $1,216 | $138,470 | $24,570 | $113,900 |
| 2021 | $1,216 | $138,470 | $24,570 | $113,900 |
| 2020 | $1,207 | $138,470 | $24,570 | $113,900 |
| 2019 | $1,207 | $138,470 | $24,570 | $113,900 |
| 2018 | $1,194 | $132,600 | $24,570 | $108,030 |
| 2016 | $1,163 | $132,596 | $24,570 | $108,026 |
| 2015 | $1,166 | $132,596 | $24,570 | $108,026 |
| 2014 | $1,166 | $132,596 | $24,570 | $108,026 |
Source: Public Records
Map
Nearby Homes
- 7358 Davis Country Rd
- 0 Harlow Rd
- 0 Davis Country Rd
- 2060 Coltrane Mill Rd
- 0 Tom Ball Rd
- 2505 Banner Whitehead Rd
- 9180 River Mill Rd
- 5590 Old Cedar Square Rd
- 8434 Us Highway 311
- 0 Old Cedar Square Rd
- 7653 Adams Farm Rd
- 9256 Us Highway 311
- 4869 Old Edgar Rd
- 0-B Us Highway 311
- 2743 Whispering Way
- 6047 Suits Rd
- 0 Crestwood Dr
- 5355 Old Walker Mill Rd
- 2549 Mary Viola Dr
- 0 Kreamer Dr
- 6968 Cedar Square Rd
- 6884 Cedar Square Rd
- 6961 Cedar Square Rd
- 6913 Cedar Square Rd
- 6927 Cedar Square Rd
- 6874 Cedar Square Rd
- 6876 Cedar Square Rd
- 1986 Greendale Rd
- 6111 Pinewood Dr
- 6854 Cedar Square Rd
- 1781 Greendale Rd
- 1765 Greendale Rd
- 6118 Pinewood Dr
- 6141 Pinewood Dr
- 6838 Cedar Square Rd
- 6871 Cedar Square Rd
- 1741 Greendale Rd
- 6140 Pinewood Dr
- 7060 Cedar Square Rd
- 6153 Pinewood Dr
Your Personal Tour Guide
Ask me questions while you tour the home.