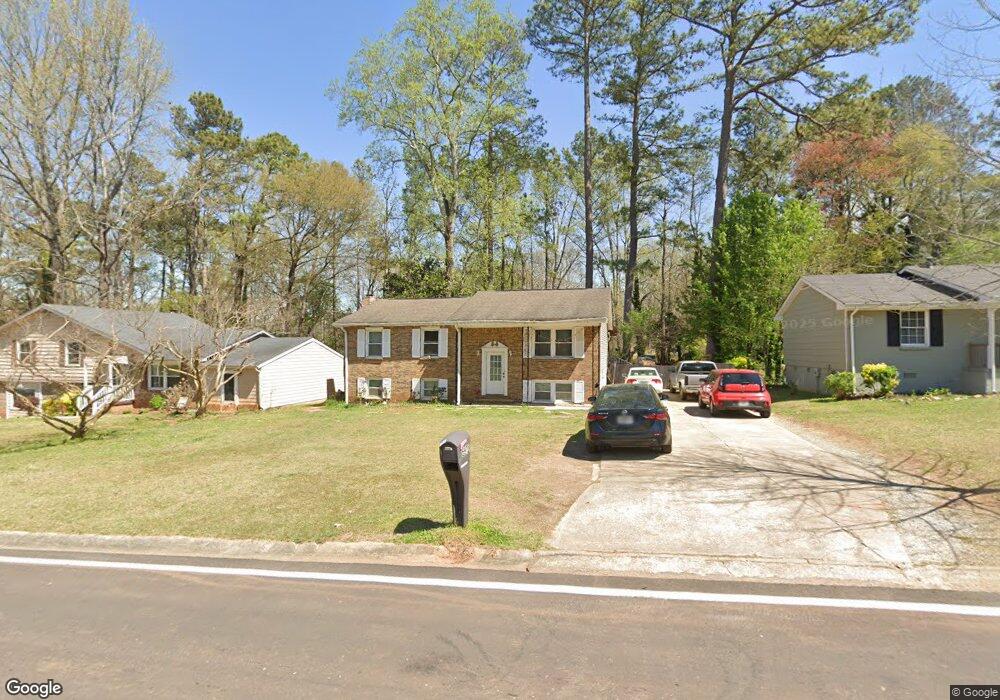
6918 Maddox Rd Unit II Morrow, GA 30260
Estimated Value: $222,220 - $248,000
3
Beds
3
Baths
2,268
Sq Ft
$105/Sq Ft
Est. Value
About This Home
This home is located at 6918 Maddox Rd Unit II, Morrow, GA 30260 and is currently estimated at $239,055, approximately $105 per square foot. 6918 Maddox Rd Unit II is a home located in Clayton County with nearby schools including Mt. Zion Primary School, Mount Zion Elementary School, and Rex Mill Middle School.
Ownership History
Date
Name
Owned For
Owner Type
Purchase Details
Closed on
Jun 28, 2002
Sold by
Hud
Bought by
Nunez Pedro V
Current Estimated Value
Home Financials for this Owner
Home Financials are based on the most recent Mortgage that was taken out on this home.
Original Mortgage
$64,900
Outstanding Balance
$27,590
Interest Rate
6.75%
Mortgage Type
New Conventional
Estimated Equity
$211,465
Purchase Details
Closed on
Oct 2, 2001
Sold by
Bolton Reuben
Bought by
Homeside Lending Inc
Purchase Details
Closed on
Jan 2, 2001
Sold by
Homeside Lending Inc
Bought by
Sec Of Hud
Purchase Details
Closed on
Jan 12, 1998
Sold by
Ringo Deborah A
Bought by
Bolton Reuben
Home Financials for this Owner
Home Financials are based on the most recent Mortgage that was taken out on this home.
Original Mortgage
$73,722
Interest Rate
7.16%
Mortgage Type
FHA
Purchase Details
Closed on
Dec 1, 1993
Sold by
James Marion C Gwendolyn
Bought by
Falls Deborah A
Create a Home Valuation Report for This Property
The Home Valuation Report is an in-depth analysis detailing your home's value as well as a comparison with similar homes in the area
Home Values in the Area
Average Home Value in this Area
Purchase History
| Date | Buyer | Sale Price | Title Company |
|---|---|---|---|
| Nunez Pedro V | -- | -- | |
| Homeside Lending Inc | $84,959 | -- | |
| Sec Of Hud | -- | -- | |
| Bolton Reuben | $75,400 | -- | |
| Falls Deborah A | $68,900 | -- |
Source: Public Records
Mortgage History
| Date | Status | Borrower | Loan Amount |
|---|---|---|---|
| Open | Nunez Pedro V | $64,900 | |
| Previous Owner | Bolton Reuben | $73,722 | |
| Closed | Falls Deborah A | -- |
Source: Public Records
Tax History Compared to Growth
Tax History
| Year | Tax Paid | Tax Assessment Tax Assessment Total Assessment is a certain percentage of the fair market value that is determined by local assessors to be the total taxable value of land and additions on the property. | Land | Improvement |
|---|---|---|---|---|
| 2024 | $2,934 | $75,200 | $7,200 | $68,000 |
| 2023 | $2,348 | $65,040 | $7,200 | $57,840 |
| 2022 | $1,970 | $50,200 | $7,200 | $43,000 |
| 2021 | $1,769 | $44,800 | $7,200 | $37,600 |
| 2020 | $1,674 | $41,846 | $7,200 | $34,646 |
| 2019 | $1,507 | $37,113 | $5,600 | $31,513 |
| 2018 | $1,281 | $31,550 | $5,600 | $25,950 |
| 2017 | $1,041 | $25,587 | $5,600 | $19,987 |
| 2016 | $956 | $23,503 | $5,600 | $17,903 |
| 2015 | $886 | $0 | $0 | $0 |
| 2014 | $973 | $24,465 | $5,600 | $18,865 |
Source: Public Records
Map
Nearby Homes
- 6852 Silver Maple Dr
- 2681 Heritage Ln
- 2705 Heritage Ln
- 6848 Silver Maple Dr
- 6844 Silver Maple Dr
- 2688 Heritage Ln
- 2877 Kensington Way
- 2845 Heritage Ln
- 2881 Panther Ct
- 2968 Preston Dr
- 2613 Stratford Ln Unit 3
- 6584 Sleepy Hollow Ln
- 2617 Terrace Pkwy
- 6968 Fielder Rd
- 2959 Drexel Ln
- 2783 Mill Lake Way
- 2933 Bretton Dr
- 6921 Babbling Brook Dr
- 6924 Maddox Rd
- 6924 Maddox Rd
- 6924 Maddox Rd Unit 2
- 6910 Maddox Rd Unit 2
- 6902 Maddox Rd
- 6936 Maddox Rd
- 6919 Vesta Brook Dr
- 6927 Vesta Brook Dr
- 6911 Vesta Brook Dr Unit 3
- 6913 Stratton Cir Unit 2
- 6905 Vesta Brook Dr
- 6933 Vesta Brook Dr
- 6892 Maddox Rd Unit 2
- 6944 Maddox Rd Unit 2
- 2600 Crabapple Ln
- 6899 Maddox Rd
- 6895 Vesta Brook Dr
- 6941 Vesta Brook Dr
- 6907 Stratton Cir
- 6952 Maddox Rd