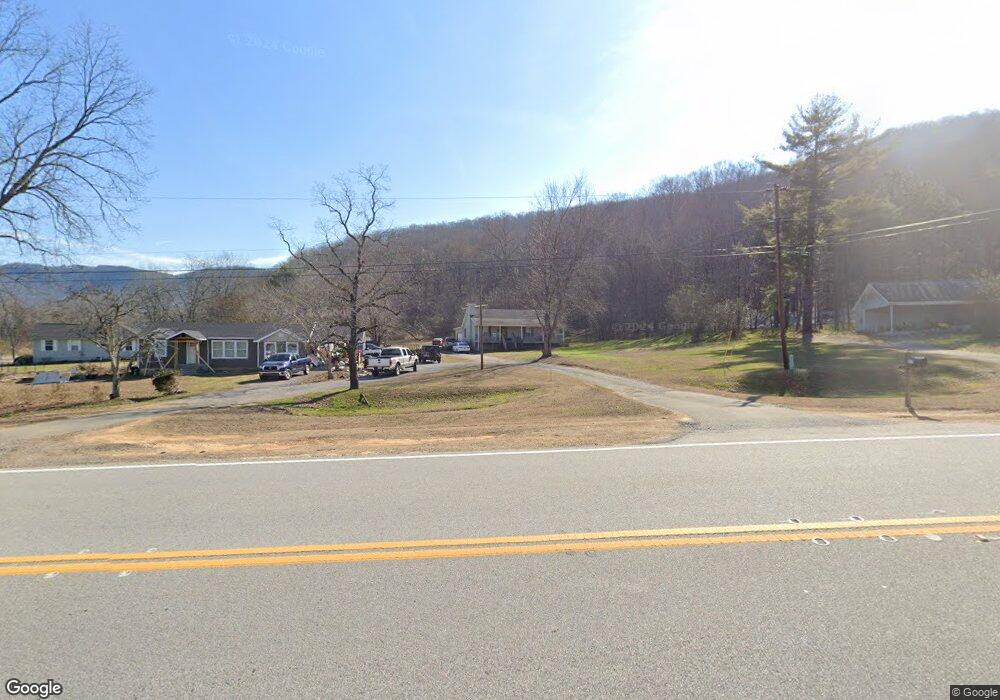
6919 Highway 136 Trenton, GA 30752
Estimated Value: $217,000 - $255,000
3
Beds
2
Baths
1,232
Sq Ft
$187/Sq Ft
Est. Value
About This Home
This home is located at 6919 Highway 136, Trenton, GA 30752 and is currently estimated at $230,358, approximately $186 per square foot. 6919 Highway 136 is a home located in Dade County with nearby schools including Dade Middle School and Dade County High School.
Ownership History
Date
Name
Owned For
Owner Type
Purchase Details
Closed on
Sep 30, 2005
Sold by
Household Realty Corp
Bought by
Sharp Jason and Sharp Kendra
Current Estimated Value
Home Financials for this Owner
Home Financials are based on the most recent Mortgage that was taken out on this home.
Original Mortgage
$69,600
Outstanding Balance
$37,018
Interest Rate
5.66%
Mortgage Type
New Conventional
Estimated Equity
$193,340
Purchase Details
Closed on
Sep 29, 2005
Sold by
Household Reality Corporat
Bought by
Sharp Jason and Sharp Kendra L
Home Financials for this Owner
Home Financials are based on the most recent Mortgage that was taken out on this home.
Original Mortgage
$69,600
Outstanding Balance
$37,018
Interest Rate
5.66%
Mortgage Type
New Conventional
Estimated Equity
$193,340
Purchase Details
Closed on
May 3, 2005
Sold by
Hartline Stanley J A
Bought by
Household Realty Corp
Purchase Details
Closed on
Oct 11, 1996
Sold by
Childress James
Bought by
Hartline Stanley J A
Purchase Details
Closed on
Jun 22, 1985
Purchase Details
Closed on
Jan 3, 1985
Sold by
Gaddis Derrell W
Create a Home Valuation Report for This Property
The Home Valuation Report is an in-depth analysis detailing your home's value as well as a comparison with similar homes in the area
Home Values in the Area
Average Home Value in this Area
Purchase History
| Date | Buyer | Sale Price | Title Company |
|---|---|---|---|
| Sharp Jason | $87,000 | -- | |
| Sharp Jason | $43,500 | -- | |
| Household Realty Corp | -- | -- | |
| Hartline Stanley J A | $20,500 | -- | |
| -- | -- | -- | |
| -- | -- | -- |
Source: Public Records
Mortgage History
| Date | Status | Borrower | Loan Amount |
|---|---|---|---|
| Open | Sharp Jason | $69,600 |
Source: Public Records
Tax History Compared to Growth
Tax History
| Year | Tax Paid | Tax Assessment Tax Assessment Total Assessment is a certain percentage of the fair market value that is determined by local assessors to be the total taxable value of land and additions on the property. | Land | Improvement |
|---|---|---|---|---|
| 2024 | $844 | $72,040 | $2,800 | $69,240 |
| 2023 | $1,493 | $66,680 | $2,800 | $63,880 |
| 2022 | $851 | $61,840 | $2,800 | $59,040 |
| 2021 | $859 | $49,720 | $2,800 | $46,920 |
| 2020 | $895 | $45,480 | $1,440 | $44,040 |
| 2019 | $904 | $44,800 | $1,440 | $43,360 |
| 2018 | $1,080 | $45,000 | $1,640 | $43,360 |
| 2017 | $885 | $38,880 | $1,640 | $37,240 |
| 2016 | $876 | $38,640 | $1,400 | $37,240 |
| 2015 | $896 | $40,840 | $3,600 | $37,240 |
| 2014 | -- | $40,400 | $3,600 | $36,800 |
| 2013 | -- | $40,720 | $3,600 | $37,120 |
Source: Public Records
Map
Nearby Homes
- 738 Sells Ln
- 493 Bernice Dr
- 102 Sunset Dr
- 329 Glenview Dr
- 396 Glenview Dr
- 331 Glenview Dr
- 394 Glenview Dr
- 204 Melissa Dr
- 134 Melissa Dr
- 0 Georgia 136
- 11080 U S 11
- 40 Case Cir
- 51 N Case Ave
- 0 N Main St Unit RTC2821548
- 0 N Main St Unit 1511569
- 13745 N Main St
- 5432 Scenic Hwy
- 165 N Woods Ln
- 0 Northwoods Ln Unit 1521613
- 54 Whispering Pines Dr
- 6933 Highway 136
- 6909 Highway 136
- 40 Canyon Park Dr
- 56 Canyon Park Dr
- 60 Canyon Park Dr
- 33 Blackstock Ln
- 6979 Georgia 136
- 98 Canyon Park Dr
- 6853 Highway 136
- 51 Blackstock Ln
- 6936 Highway 136
- 6882 Georgia 136
- 6882 Highway 136
- 118 Canyon Park Dr
- 7103 Highway 136
- 6831 Highway 136
- 6844 Highway 136
- 138 Canyon Park Dr
- 91 Blackstock Ln
- 7103 Ga-136