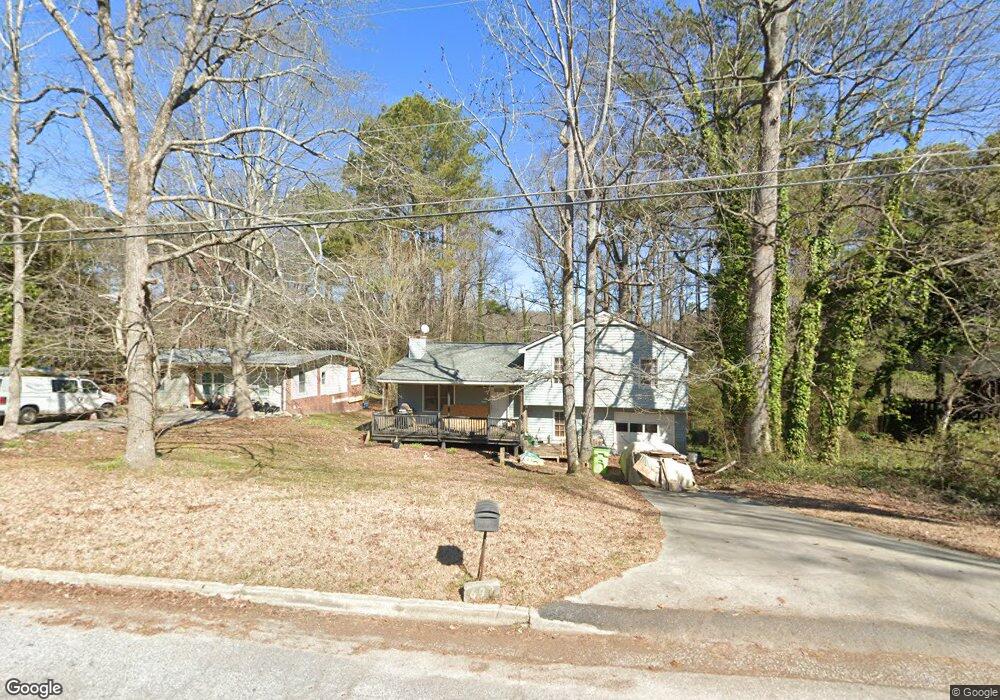
692 Factory Shoals Dr SW Mableton, GA 30126
Estimated Value: $231,024 - $278,000
3
Beds
2
Baths
1,300
Sq Ft
$201/Sq Ft
Est. Value
About This Home
This home is located at 692 Factory Shoals Dr SW, Mableton, GA 30126 and is currently estimated at $261,506, approximately $201 per square foot. 692 Factory Shoals Dr SW is a home located in Cobb County with nearby schools including Bryant Elementary School, Lindley Middle School, and Pebblebrook High School.
Ownership History
Date
Name
Owned For
Owner Type
Purchase Details
Closed on
Dec 20, 2006
Sold by
Scandrett Machelle
Bought by
Anderson David W
Current Estimated Value
Home Financials for this Owner
Home Financials are based on the most recent Mortgage that was taken out on this home.
Original Mortgage
$25,500
Interest Rate
6.1%
Mortgage Type
Stand Alone Refi Refinance Of Original Loan
Purchase Details
Closed on
Dec 30, 2004
Sold by
Jp Morgan Chase Bk
Bought by
Scandrett Machelle
Home Financials for this Owner
Home Financials are based on the most recent Mortgage that was taken out on this home.
Original Mortgage
$94,400
Interest Rate
5.61%
Mortgage Type
New Conventional
Purchase Details
Closed on
Jun 1, 2004
Sold by
Larraga Hilario
Bought by
Jpmorgan Chase Bank
Purchase Details
Closed on
Sep 26, 1997
Sold by
Cumbie Mark W and Cumbie Deidri L
Bought by
Larraga Hilario and Larraga Tonya R
Home Financials for this Owner
Home Financials are based on the most recent Mortgage that was taken out on this home.
Original Mortgage
$78,124
Interest Rate
7.6%
Mortgage Type
FHA
Create a Home Valuation Report for This Property
The Home Valuation Report is an in-depth analysis detailing your home's value as well as a comparison with similar homes in the area
Home Values in the Area
Average Home Value in this Area
Purchase History
| Date | Buyer | Sale Price | Title Company |
|---|---|---|---|
| Anderson David W | $127,500 | -- | |
| Scandrett Machelle | $104,900 | -- | |
| Jpmorgan Chase Bank | $100,300 | -- | |
| Larraga Hilario | $79,900 | -- |
Source: Public Records
Mortgage History
| Date | Status | Borrower | Loan Amount |
|---|---|---|---|
| Previous Owner | Anderson David W | $25,500 | |
| Previous Owner | Scandrett Machelle | $94,400 | |
| Previous Owner | Larraga Hilario | $78,124 |
Source: Public Records
Tax History Compared to Growth
Tax History
| Year | Tax Paid | Tax Assessment Tax Assessment Total Assessment is a certain percentage of the fair market value that is determined by local assessors to be the total taxable value of land and additions on the property. | Land | Improvement |
|---|---|---|---|---|
| 2025 | $2,176 | $95,136 | $24,000 | $71,136 |
| 2024 | $1,675 | $71,912 | $18,000 | $53,912 |
| 2023 | $1,132 | $71,912 | $18,000 | $53,912 |
| 2022 | $972 | $41,048 | $10,000 | $31,048 |
| 2021 | $972 | $41,048 | $10,000 | $31,048 |
| 2020 | $972 | $41,048 | $10,000 | $31,048 |
| 2019 | $801 | $35,412 | $6,000 | $29,412 |
| 2018 | $636 | $29,972 | $6,000 | $23,972 |
| 2017 | $347 | $20,984 | $6,000 | $14,984 |
| 2016 | $206 | $16,072 | $4,000 | $12,072 |
| 2015 | $213 | $16,072 | $4,000 | $12,072 |
| 2014 | $215 | $16,072 | $0 | $0 |
Source: Public Records
Map
Nearby Homes
- 767 Kenneth Ln SW
- 6281 Denny Ln SW
- 846 Orris Ln SW
- 377 Waterbluff Dr SW
- 537 Elizabeth Ln SW
- 373 Waterbluff Dr SW
- 368 Waterbluff Dr SW
- 364 Waterbluff Dr SW
- 365 Waterbluff Dr SW
- 496 Elizabeth Ln SW
- 6266 Britt Rd SW
- 760 W Starling Dr SW
- 6365 Susan Dr SW
- Harbor Plan at Mableton Station
- Robie Plan at Mableton Station
- Aisle Plan at Mableton Station
- Elston Plan at Mableton Station
- 6243 Honeybell Aly
- KNOLLWOOD Plan at Mableton Station - Townhomes
- 361 Gordon Valley Ln SW
- 698 Factory Shoals Dr SW
- 686 Factory Shoals Dr SW
- 720 Factory Shoals Dr SW
- 675 Kenneth Ln SW
- 619 Factory Shoals Dr SW
- 621 Factory Shoals Dr SW
- 617 Factory Shoals Dr SW
- 615 Factory Shoals Dr SW
- 623 Factory Shoals Dr SW Unit 1
- 685 Kenneth Ln SW
- 699 Kenneth Ln SW
- 613 Factory Shoals Dr SW
- 613 Factory Shoals Dr SW
- 663 Kenneth Ln SW
- 663 Kenneth Ln SW Unit B
- 663 Kenneth Ln SW Unit A
- 625 Factory Shoals Dr SW Unit 1
- 6368 Beverly Dr SW
- 721 Kenneth Ln SW
- 6358 Beverly Dr SW