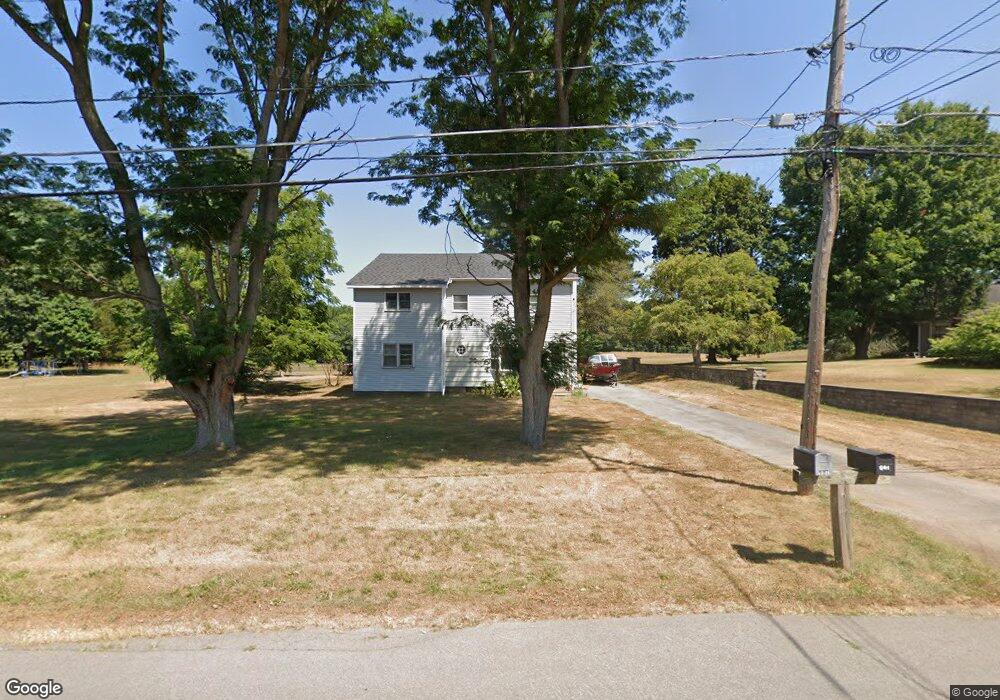
692 Maple Ave Fulton, NY 13069
Estimated Value: $198,000 - $241,000
3
Beds
2
Baths
1,552
Sq Ft
$140/Sq Ft
Est. Value
About This Home
This home is located at 692 Maple Ave, Fulton, NY 13069 and is currently estimated at $216,806, approximately $139 per square foot. 692 Maple Ave is a home located in Oswego County with nearby schools including G Ray Bodley High School.
Ownership History
Date
Name
Owned For
Owner Type
Purchase Details
Closed on
Dec 22, 2020
Sold by
Cooper Wendell R and Bolio Ginger L
Bought by
Cooper Kyle
Current Estimated Value
Home Financials for this Owner
Home Financials are based on the most recent Mortgage that was taken out on this home.
Original Mortgage
$84,065
Outstanding Balance
$74,843
Interest Rate
2.7%
Mortgage Type
FHA
Estimated Equity
$141,963
Create a Home Valuation Report for This Property
The Home Valuation Report is an in-depth analysis detailing your home's value as well as a comparison with similar homes in the area
Home Values in the Area
Average Home Value in this Area
Purchase History
| Date | Buyer | Sale Price | Title Company |
|---|---|---|---|
| Cooper Kyle | $130,000 | Independent Title Agency Llc |
Source: Public Records
Mortgage History
| Date | Status | Borrower | Loan Amount |
|---|---|---|---|
| Open | Cooper Kyle | $84,065 |
Source: Public Records
Tax History
| Year | Tax Paid | Tax Assessment Tax Assessment Total Assessment is a certain percentage of the fair market value that is determined by local assessors to be the total taxable value of land and additions on the property. | Land | Improvement |
|---|---|---|---|---|
| 2024 | $5,108 | $114,000 | $21,400 | $92,600 |
| 2023 | $4,690 | $114,000 | $21,400 | $92,600 |
| 2022 | $4,479 | $114,000 | $21,400 | $92,600 |
| 2021 | $4,388 | $114,000 | $21,400 | $92,600 |
| 2020 | $4,044 | $114,000 | $21,400 | $92,600 |
| 2019 | $3,850 | $114,000 | $21,400 | $92,600 |
| 2018 | $3,850 | $114,000 | $21,400 | $92,600 |
| 2017 | $3,820 | $114,000 | $21,400 | $92,600 |
| 2016 | $3,831 | $112,000 | $21,400 | $90,600 |
| 2015 | -- | $112,000 | $21,400 | $90,600 |
| 2014 | -- | $112,000 | $21,400 | $90,600 |
Source: Public Records
Map
Nearby Homes
Your Personal Tour Guide
Ask me questions while you tour the home.