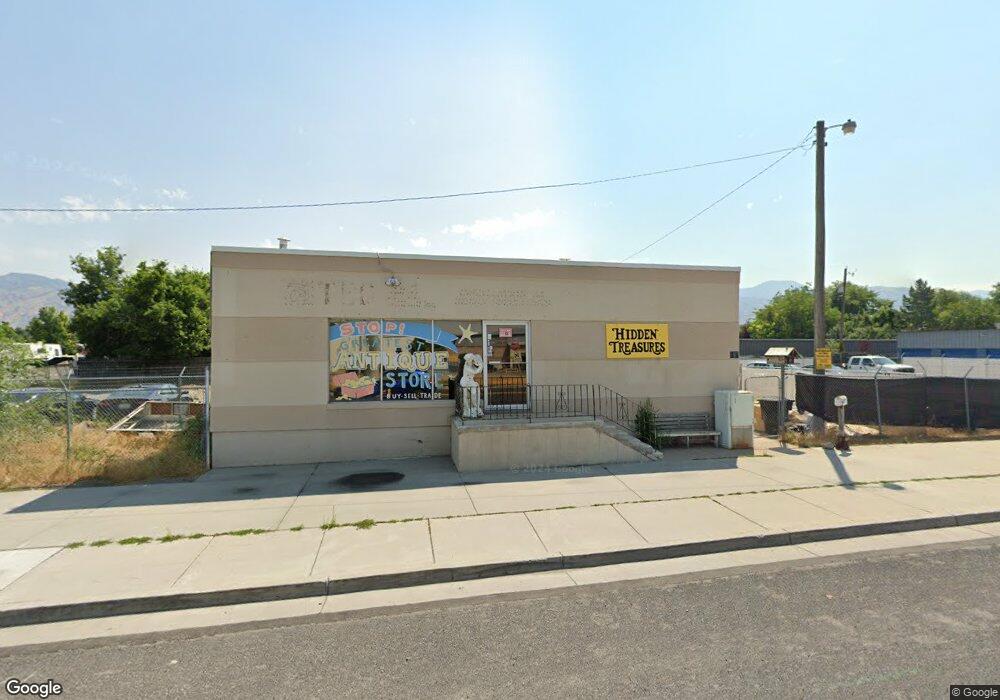
692 N 600 W Logan, UT 84321
Bridger NeighborhoodEstimated Value: $540,000
--
Bed
--
Bath
4,431
Sq Ft
$122/Sq Ft
Est. Value
About This Home
This home is located at 692 N 600 W, Logan, UT 84321 and is currently estimated at $540,000, approximately $121 per square foot. 692 N 600 W is a home located in Cache County with nearby schools including Bridger School, Mount Logan Middle School, and Logan High School.
Ownership History
Date
Name
Owned For
Owner Type
Purchase Details
Closed on
Jan 21, 2015
Sold by
C A Fullmer Family Llc
Bought by
Tsbk Llc
Current Estimated Value
Home Financials for this Owner
Home Financials are based on the most recent Mortgage that was taken out on this home.
Original Mortgage
$151,665
Outstanding Balance
$115,960
Interest Rate
3.87%
Mortgage Type
Commercial
Estimated Equity
$424,040
Purchase Details
Closed on
Aug 24, 2012
Sold by
Booth John
Bought by
C A Fullmer Family Llc
Purchase Details
Closed on
Aug 8, 2011
Sold by
Rutledge John C
Bought by
Booth John
Create a Home Valuation Report for This Property
The Home Valuation Report is an in-depth analysis detailing your home's value as well as a comparison with similar homes in the area
Home Values in the Area
Average Home Value in this Area
Purchase History
| Date | Buyer | Sale Price | Title Company |
|---|---|---|---|
| Tsbk Llc | -- | Hickman Land Title Company | |
| C A Fullmer Family Llc | -- | Hickman Land Title Company | |
| Booth John | -- | Cache Title Company |
Source: Public Records
Mortgage History
| Date | Status | Borrower | Loan Amount |
|---|---|---|---|
| Open | Tsbk Llc | $151,665 |
Source: Public Records
Tax History Compared to Growth
Tax History
| Year | Tax Paid | Tax Assessment Tax Assessment Total Assessment is a certain percentage of the fair market value that is determined by local assessors to be the total taxable value of land and additions on the property. | Land | Improvement |
|---|---|---|---|---|
| 2025 | $5,719 | $739,636 | $548,856 | $190,780 |
| 2024 | $3,946 | $494,286 | $302,556 | $191,730 |
| 2023 | $4,019 | $479,879 | $288,149 | $191,730 |
| 2022 | $4,181 | $466,158 | $274,428 | $191,730 |
| 2021 | $3,256 | $308,487 | $125,887 | $182,600 |
| 2020 | $3,618 | $308,487 | $125,887 | $182,600 |
| 2019 | $3,541 | $288,887 | $125,887 | $163,000 |
| 2018 | $3,879 | $288,887 | $125,887 | $163,000 |
| 2017 | $4,035 | $288,885 | $0 | $0 |
| 2016 | $4,183 | $279,740 | $0 | $0 |
| 2015 | $3,436 | $237,005 | $0 | $0 |
| 2014 | $3,106 | $237,005 | $0 | $0 |
| 2013 | -- | $237,005 | $0 | $0 |
Source: Public Records
Map
Nearby Homes