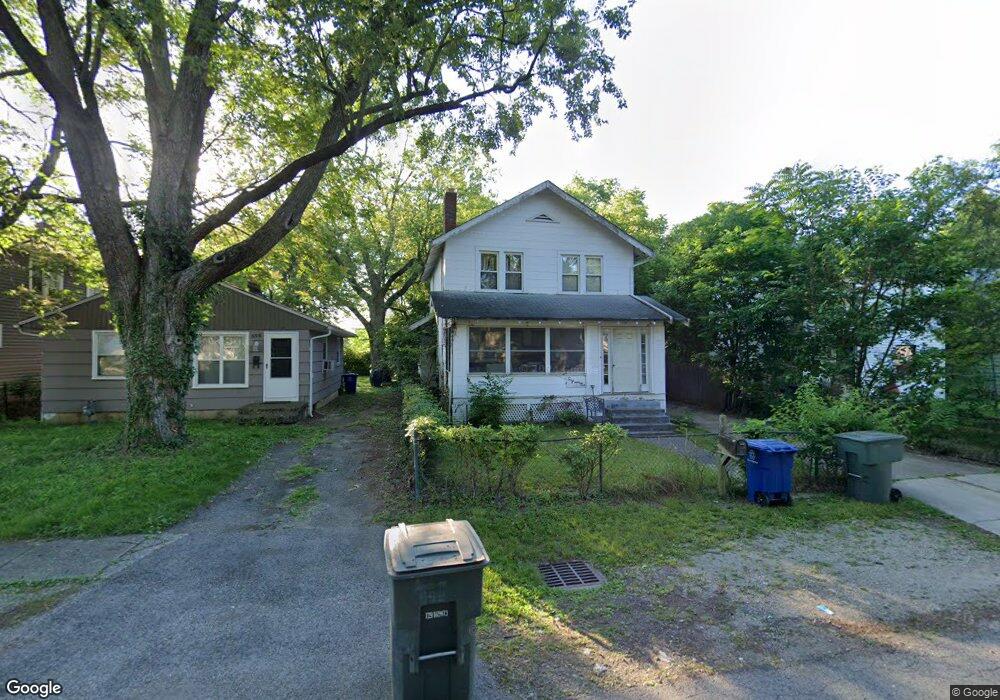
692 N Dawson Ave Columbus, OH 43219
Estimated Value: $170,000 - $191,323
4
Beds
2
Baths
1,384
Sq Ft
$130/Sq Ft
Est. Value
About This Home
This home is located at 692 N Dawson Ave, Columbus, OH 43219 and is currently estimated at $180,581, approximately $130 per square foot. 692 N Dawson Ave is a home located in Franklin County with nearby schools including East Columbus Elementary School, Champion Middle School, and East High School.
Ownership History
Date
Name
Owned For
Owner Type
Purchase Details
Closed on
Dec 12, 2008
Sold by
Henderson Mekel
Bought by
Siler Anthony
Current Estimated Value
Purchase Details
Closed on
Dec 11, 2008
Sold by
Secretary Of Housing & Urban Development
Bought by
Henderson Mekel
Purchase Details
Closed on
Mar 19, 2007
Sold by
Brown Natalie N and Opteum Financial Services Llc
Bought by
Hud
Purchase Details
Closed on
Sep 23, 2003
Sold by
Ebuer Real Estate Management Inc
Bought by
Brown Natalie N
Home Financials for this Owner
Home Financials are based on the most recent Mortgage that was taken out on this home.
Original Mortgage
$77,287
Interest Rate
6.43%
Mortgage Type
FHA
Purchase Details
Closed on
Feb 24, 2003
Sold by
Estate Of Lester Craig
Bought by
Craig Sandra C
Purchase Details
Closed on
Feb 21, 2003
Sold by
Mashburn John B and Estate Of Sandra C Craig
Bought by
Ebner Real Estate Management Inc
Purchase Details
Closed on
Dec 30, 1974
Bought by
Craig Lester E
Create a Home Valuation Report for This Property
The Home Valuation Report is an in-depth analysis detailing your home's value as well as a comparison with similar homes in the area
Home Values in the Area
Average Home Value in this Area
Purchase History
| Date | Buyer | Sale Price | Title Company |
|---|---|---|---|
| Siler Anthony | $13,500 | Peak Title | |
| Henderson Mekel | $7,501 | Lakeside Ti | |
| Hud | $38,000 | None Available | |
| Brown Natalie N | $78,500 | Titlequest Agency Inc | |
| Craig Sandra C | -- | -- | |
| Ebner Real Estate Management Inc | $41,250 | -- | |
| Craig Lester E | -- | -- |
Source: Public Records
Mortgage History
| Date | Status | Borrower | Loan Amount |
|---|---|---|---|
| Previous Owner | Brown Natalie N | $77,287 |
Source: Public Records
Tax History
| Year | Tax Paid | Tax Assessment Tax Assessment Total Assessment is a certain percentage of the fair market value that is determined by local assessors to be the total taxable value of land and additions on the property. | Land | Improvement |
|---|---|---|---|---|
| 2025 | $5,945 | $52,640 | $9,940 | $42,700 |
| 2024 | $5,945 | $52,640 | $9,940 | $42,700 |
| 2023 | $2,332 | $52,640 | $9,940 | $42,700 |
| 2022 | $1,926 | $16,490 | $1,680 | $14,810 |
| 2021 | $1,020 | $16,490 | $1,680 | $14,810 |
| 2020 | $964 | $16,490 | $1,680 | $14,810 |
| 2019 | $911 | $15,020 | $1,510 | $13,510 |
| 2018 | $1,021 | $15,020 | $1,510 | $13,510 |
| 2017 | $1,079 | $15,020 | $1,510 | $13,510 |
| 2016 | $1,247 | $18,830 | $2,450 | $16,380 |
| 2015 | $1,132 | $18,830 | $2,450 | $16,380 |
| 2014 | $1,135 | $18,830 | $2,450 | $16,380 |
| 2013 | $658 | $22,120 | $2,870 | $19,250 |
Source: Public Records
Map
Nearby Homes
- 696 Northview Ave
- 629 N Dawson Ave
- 2570 E 5th Ave
- 2814 E 9th Ave
- 2822 Bellwood Ave
- 2841 E 10th Ave
- 2779 Columbus Ave
- 386 Northview Dr
- 2974 E 7th Ave
- 343 N Cassady Ave
- 2864 E 10th Ave
- 484 N Parkview Ave
- 0 E 7th Ave Unit Lot 79 225013171
- 0 E 7th Ave Unit Lot 77 225013170
- 0 E 7th Ave Unit Lot 78 225013168
- 00 E 7th Ave
- 2324 Ridgeway Ave
- 2969 E 11th Ave
- 2262 Willamont Ave
- 649 N Nelson Rd Unit A-D
- 688 N Dawson Ave
- 698 N Dawson Ave
- 702 N Dawson Ave Unit 704
- 682 N Dawson Ave
- 702-704 N Dawson Ave Unit 1
- 702-704 N Dawson Ave
- 700 N Dawson Ave
- 676 N Dawson Ave
- 691 N Dawson Ave Unit 693
- 0 Dawson Ave
- 687 N Dawson Ave
- 705 N Dawson Ave
- 683 N Dawson Ave
- 664 N Dawson Ave
- 677 N Dawson Ave
- 2649 E 5th Ave
- 658 N Dawson Ave
- 663 N Dawson Ave
- 2639 E 5th Ave
- 652 N Dawson Ave
Your Personal Tour Guide
Ask me questions while you tour the home.