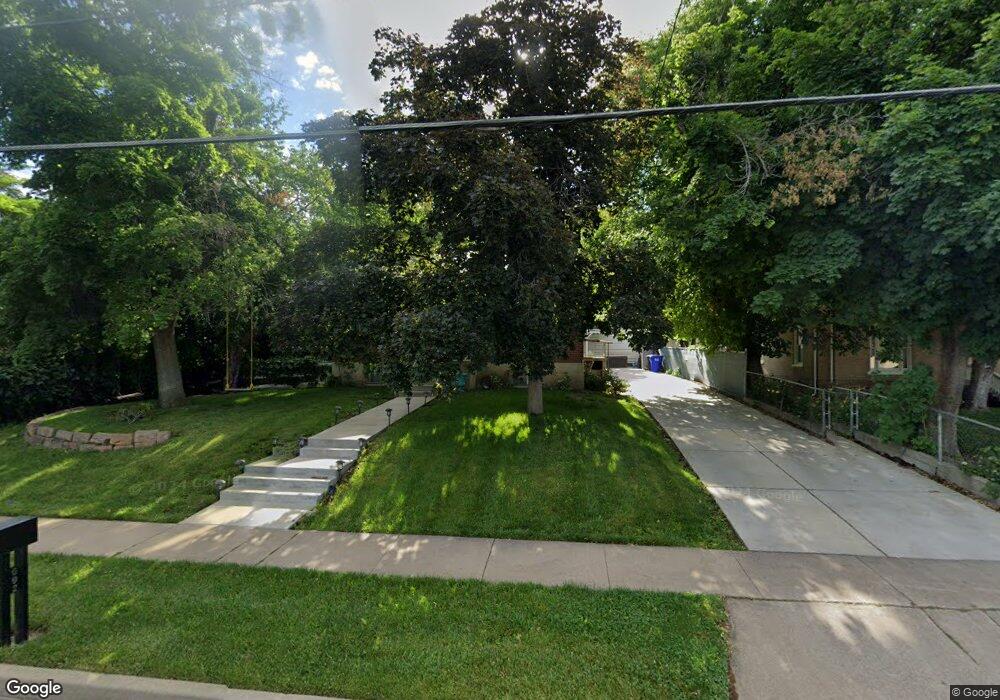
692 N Main St Centerville, UT 84014
Estimated Value: $427,000 - $517,511
4
Beds
2
Baths
1,836
Sq Ft
$261/Sq Ft
Est. Value
About This Home
This home is located at 692 N Main St, Centerville, UT 84014 and is currently estimated at $478,878, approximately $260 per square foot. 692 N Main St is a home located in Davis County with nearby schools including Centerville Elementary, Centerville Jr High, and Viewmont High School.
Ownership History
Date
Name
Owned For
Owner Type
Purchase Details
Closed on
Feb 11, 2026
Sold by
Rohletter Zachary and Rohletter Sheyra
Bought by
Zachary H And Sheyra L Rohletter Revocable Fa and Rohletter
Current Estimated Value
Purchase Details
Closed on
Aug 29, 2016
Sold by
Barney Kyle and Barney Ashley
Bought by
Rohletter Zachary and Rohletter Sheryra
Purchase Details
Closed on
Sep 25, 2013
Sold by
Pemberton Mark A
Bought by
Barney Kyle and Barney Ashley
Home Financials for this Owner
Home Financials are based on the most recent Mortgage that was taken out on this home.
Original Mortgage
$187,210
Interest Rate
4.46%
Mortgage Type
New Conventional
Purchase Details
Closed on
Apr 8, 1998
Sold by
Jenkins Curtis D and Jenkins Kelly A
Bought by
Pemberton Mark A
Home Financials for this Owner
Home Financials are based on the most recent Mortgage that was taken out on this home.
Original Mortgage
$118,814
Interest Rate
7.07%
Mortgage Type
FHA
Create a Home Valuation Report for This Property
The Home Valuation Report is an in-depth analysis detailing your home's value as well as a comparison with similar homes in the area
Purchase History
| Date | Buyer | Sale Price | Title Company |
|---|---|---|---|
| Zachary H And Sheyra L Rohletter Revocable Fa | -- | None Listed On Document | |
| Rohletter Zachary | -- | Vanguard Title | |
| Barney Kyle | -- | None Available | |
| Pemberton Mark A | -- | Associated Title Company |
Source: Public Records
Mortgage History
| Date | Status | Borrower | Loan Amount |
|---|---|---|---|
| Previous Owner | Barney Kyle | $187,210 | |
| Previous Owner | Pemberton Mark A | $118,814 |
Source: Public Records
Tax History
| Year | Tax Paid | Tax Assessment Tax Assessment Total Assessment is a certain percentage of the fair market value that is determined by local assessors to be the total taxable value of land and additions on the property. | Land | Improvement |
|---|---|---|---|---|
| 2025 | $2,323 | $222,200 | $163,011 | $59,189 |
| 2024 | $2,227 | $216,700 | $146,436 | $70,264 |
| 2023 | $2,156 | $379,000 | $240,310 | $138,690 |
| 2022 | $2,488 | $218,350 | $121,321 | $97,029 |
| 2021 | $2,251 | $305,000 | $184,991 | $120,009 |
| 2020 | $2,059 | $272,000 | $180,801 | $91,199 |
| 2019 | $1,875 | $251,000 | $181,637 | $69,363 |
| 2018 | $1,677 | $228,000 | $168,565 | $59,435 |
| 2016 | $1,293 | $104,500 | $56,291 | $48,209 |
| 2015 | $1,257 | $95,865 | $56,291 | $39,574 |
| 2014 | $1,269 | $99,058 | $56,291 | $42,767 |
| 2013 | -- | $91,789 | $44,204 | $47,585 |
Source: Public Records
Map
Nearby Homes
- 66 Brookside Ln
- 775 Pheasantbrook Cir
- 22 Creekside Ln
- 281 W 650 N Unit B
- 292 W 680 N
- 282 W 605 N Unit A
- 282 W 605 N Unit I
- 563 N 220 E
- 303 W 650 N Unit I
- 781 Pheasantbrook Dr
- 295 E 500 N
- 271 Brookfield Ln
- 493 W 620 N Unit 122
- 56 W 200 N
- 507 W 620 N
- 380 E 400 N
- 984 N 500 E
- 252 N 400 E
- 147 N 360 W Unit 21
- 1238 N 450 W
Your Personal Tour Guide
Ask me questions while you tour the home.