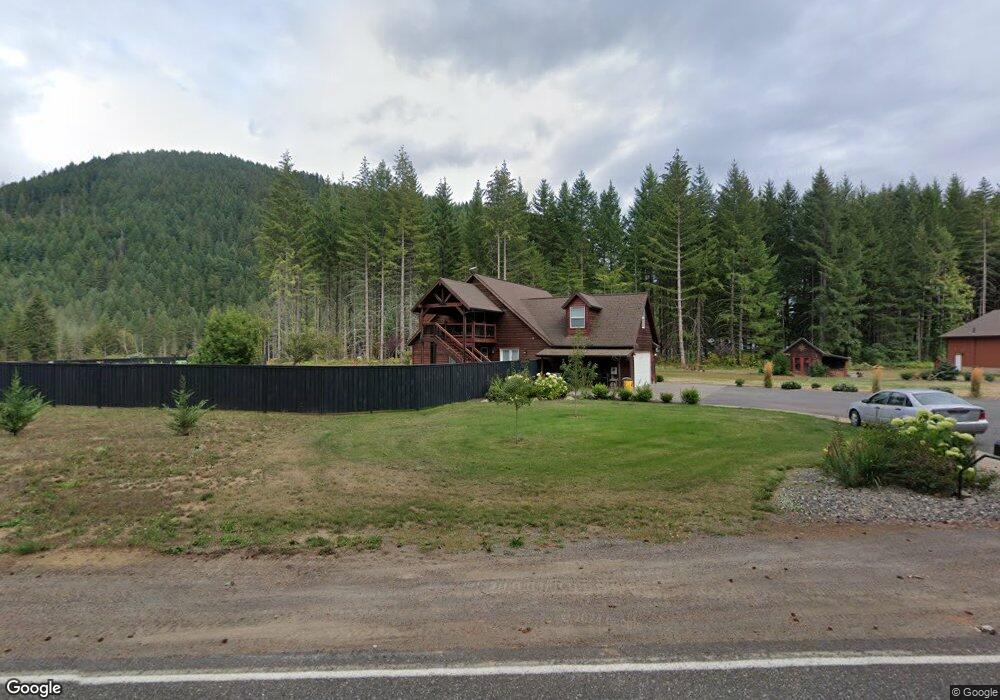
692 Old State Rd Carson, WA 98610
Estimated Value: $642,000 - $867,000
3
Beds
3
Baths
3,728
Sq Ft
$206/Sq Ft
Est. Value
About This Home
This home is located at 692 Old State Rd, Carson, WA 98610 and is currently estimated at $769,042, approximately $206 per square foot. 692 Old State Rd is a home located in Skamania County with nearby schools including Carson Elementary School, Stevenson Elementary School, and Wind River Middle School.
Ownership History
Date
Name
Owned For
Owner Type
Purchase Details
Closed on
Sep 14, 2023
Sold by
Pearson Darci L and Pearson Martin P
Bought by
Pearson Trust and Pearson
Current Estimated Value
Purchase Details
Closed on
Feb 12, 2021
Sold by
Pearson Darci L and Pearson Martin P
Bought by
Pearson Darci L and Pearson Martin P
Home Financials for this Owner
Home Financials are based on the most recent Mortgage that was taken out on this home.
Original Mortgage
$456,000
Interest Rate
2.7%
Mortgage Type
New Conventional
Purchase Details
Closed on
Nov 13, 2013
Sold by
Mathany Derek B and Mathany Darci L
Bought by
Mathany Darci L
Home Financials for this Owner
Home Financials are based on the most recent Mortgage that was taken out on this home.
Original Mortgage
$130,200
Interest Rate
4.18%
Mortgage Type
New Conventional
Create a Home Valuation Report for This Property
The Home Valuation Report is an in-depth analysis detailing your home's value as well as a comparison with similar homes in the area
Purchase History
| Date | Buyer | Sale Price | Title Company |
|---|---|---|---|
| Pearson Trust | -- | None Listed On Document | |
| Pearson Darci L | -- | None Available | |
| Mathany Darci L | -- | Clark County Title Company |
Source: Public Records
Mortgage History
| Date | Status | Borrower | Loan Amount |
|---|---|---|---|
| Previous Owner | Pearson Darci L | $456,000 | |
| Previous Owner | Mathany Darci L | $130,200 |
Source: Public Records
Tax History
| Year | Tax Paid | Tax Assessment Tax Assessment Total Assessment is a certain percentage of the fair market value that is determined by local assessors to be the total taxable value of land and additions on the property. | Land | Improvement |
|---|---|---|---|---|
| 2025 | $5,387 | $648,900 | $162,000 | $486,900 |
| 2024 | $5,164 | $608,900 | $152,000 | $456,900 |
| 2023 | $4,741 | $557,700 | $127,000 | $430,700 |
| 2022 | $4,714 | $486,500 | $112,000 | $374,500 |
| 2021 | $3,482 | $344,300 | $83,000 | $261,300 |
| 2020 | $3,595 | $344,300 | $83,000 | $261,300 |
| 2019 | $2,944 | $308,000 | $78,000 | $230,000 |
| 2018 | $3,344 | $308,000 | $78,000 | $230,000 |
| 2017 | $2,151 | $308,000 | $78,000 | $230,000 |
| 2015 | $2,819 | $279,000 | $78,000 | $201,000 |
| 2013 | -- | $279,000 | $78,000 | $201,000 |
Source: Public Records
Map
Nearby Homes
- 0 Boulder Ridge Unit 283611920
- 0 Bear Creek Rd
- 111 Mathany Rd
- 0 Mathany Rd Unit 117462889
- 152 Estabrook Rd
- 252 Estabrook Loop
- 52 Estabrook Loop
- 181 Vada St
- 252 Blackledge Rd
- 51 Foster Rd
- 0 Heslen Rd Unit 652803999
- 11 Edgewater Dr
- 3031 Loop Rd
- 291 Metzger Rd
- 722 Smith Beacon Rd
- 72 Cheryl Ln
- 52 Fredrickson Ave
- 564 Hot Springs Ave
- 271 Old Airport Rd
- 0 Carson Depot Rd
- 552 Old State Rd
- 631 Old State Rd
- 512 Old State Rd
- 751 Old State Rd
- 7662 Wind River Rd
- 42 Boulder Ridge Dr
- 852 Old State Rd
- 791 Old State Rd
- 0 Old State Rd Unit 5 16691679
- 0 Old State Rd
- 5471 Wind River Rd
- 1011 Old State Rd
- 422 Boulder Ridge Dr Unit Lot 9
- 5282 Wind River Rd
- 31 Kek Rd
- 52 Borden Rd
- 5231 Wind River Hwy
- 1091 Old State Rd
- 192 Boulder Ridge Dr
- 0 Boulder Ridge Unit 24665205
Your Personal Tour Guide
Ask me questions while you tour the home.