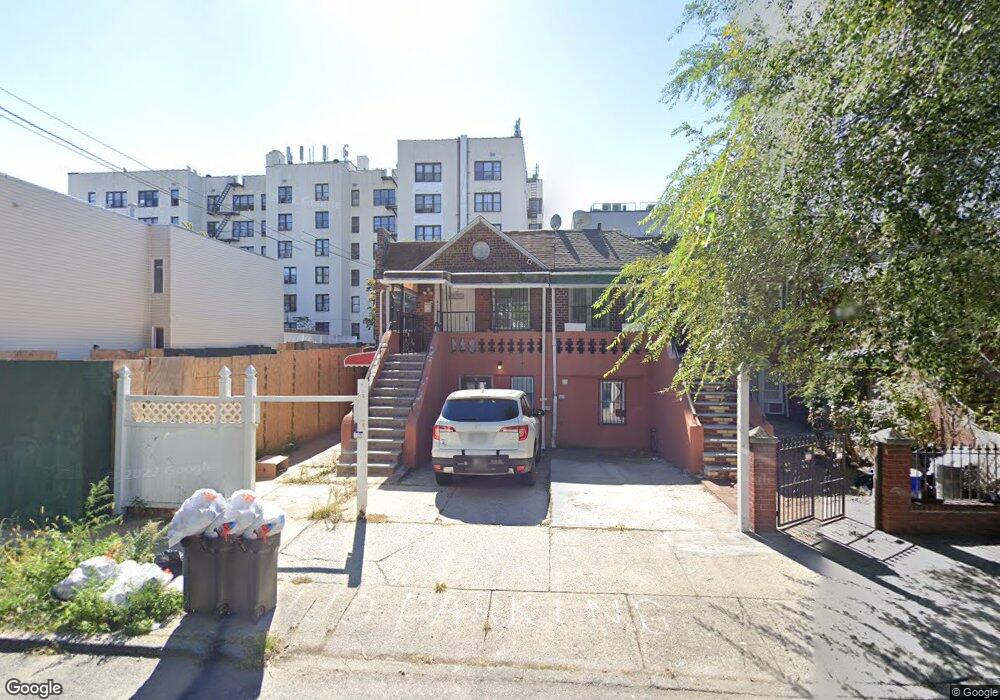
692 Rutland Rd Brooklyn, NY 11203
East Flatbush NeighborhoodEstimated Value: $705,000 - $837,000
--
Bed
--
Bath
1,334
Sq Ft
$578/Sq Ft
Est. Value
About This Home
This home is located at 692 Rutland Rd, Brooklyn, NY 11203 and is currently estimated at $770,795, approximately $577 per square foot. 692 Rutland Rd is a home located in Kings County with nearby schools including P.S. 91 The Albany Avenue School, New Heights Middle School, and Bnos Menachem School for Girls.
Ownership History
Date
Name
Owned For
Owner Type
Purchase Details
Closed on
Nov 19, 2019
Sold by
692 Rutland Llc
Bought by
Richler Yisroel
Current Estimated Value
Home Financials for this Owner
Home Financials are based on the most recent Mortgage that was taken out on this home.
Original Mortgage
$686,000
Outstanding Balance
$603,503
Interest Rate
3.6%
Mortgage Type
New Conventional
Estimated Equity
$167,292
Purchase Details
Closed on
Jul 16, 2019
Sold by
Miller Alvin
Bought by
692 Rutland Llc
Purchase Details
Closed on
Feb 12, 2007
Sold by
City Homes Development Inc
Bought by
Miller Alvin
Home Financials for this Owner
Home Financials are based on the most recent Mortgage that was taken out on this home.
Original Mortgage
$121,250
Interest Rate
6.23%
Purchase Details
Closed on
Sep 7, 2006
Sold by
Avanesov Rolland
Bought by
City Homes Development Inc
Purchase Details
Closed on
Jul 17, 2006
Sold by
Dukes Frank
Bought by
Avanesov Rolland
Create a Home Valuation Report for This Property
The Home Valuation Report is an in-depth analysis detailing your home's value as well as a comparison with similar homes in the area
Home Values in the Area
Average Home Value in this Area
Purchase History
| Date | Buyer | Sale Price | Title Company |
|---|---|---|---|
| Richler Yisroel | -- | -- | |
| Richler Yisroel | -- | -- | |
| 692 Rutland Llc | $500,000 | -- | |
| 692 Rutland Llc | $500,000 | -- | |
| Miller Alvin | $498,000 | -- | |
| Miller Alvin | $498,000 | -- | |
| City Homes Development Inc | -- | -- | |
| City Homes Development Inc | -- | -- | |
| Avanesov Rolland | -- | -- | |
| Avanesov Rolland | -- | -- |
Source: Public Records
Mortgage History
| Date | Status | Borrower | Loan Amount |
|---|---|---|---|
| Open | Richler Yisroel | $686,000 | |
| Closed | Richler Yisroel | $686,000 | |
| Previous Owner | Miller Alvin | $121,250 | |
| Previous Owner | Miller Alvin | $363,750 | |
| Closed | Avanesov Rolland | $0 |
Source: Public Records
Tax History Compared to Growth
Tax History
| Year | Tax Paid | Tax Assessment Tax Assessment Total Assessment is a certain percentage of the fair market value that is determined by local assessors to be the total taxable value of land and additions on the property. | Land | Improvement |
|---|---|---|---|---|
| 2025 | $5,449 | $49,020 | $16,560 | $32,460 |
| 2024 | $5,449 | $38,700 | $16,560 | $22,140 |
| 2023 | $5,475 | $47,160 | $16,560 | $30,600 |
| 2022 | $5,375 | $38,580 | $16,560 | $22,020 |
| 2021 | $5,346 | $30,360 | $16,560 | $13,800 |
| 2020 | $2,507 | $36,840 | $16,560 | $20,280 |
| 2019 | $4,437 | $29,280 | $16,560 | $12,720 |
| 2018 | $4,282 | $22,464 | $10,973 | $11,491 |
| 2017 | $4,274 | $22,438 | $11,796 | $10,642 |
| 2016 | $3,922 | $21,168 | $11,755 | $9,413 |
| 2015 | $2,423 | $19,970 | $12,481 | $7,489 |
| 2014 | $2,423 | $18,840 | $13,800 | $5,040 |
Source: Public Records
Map
Nearby Homes
- 112 E 45th St
- 691 Winthrop St
- 122 E 46th St
- 602 Maple St
- 704 Lefferts Ave
- 770 Lefferts Ave Unit 3R
- 10 E 43rd St Unit 4K
- 10 E 43rd St Unit 5e
- 10 E 43rd St Unit 4J
- 755 Albany Ave
- 40 E 43rd St Unit 2K
- 40 E 43rd St Unit 3B
- 31 E 43rd St
- 625 Lenox Rd
- 589 Lenox Rd
- 750 Troy Ave
- 487 Midwood St
- 556 E New York Ave
- 446 Kingston Ave Unit D9
- 680 Lenox Rd
- 690 Rutland Rd
- 690 Rutland Rd Unit 1
- 690 Rutland Rd Unit 1STFLR
- 690 Rutland Rd Unit 1STFLOOR
- 694 Rutland Rd Unit 3
- 694 Rutland Rd Unit 2
- 694 Rutland Rd
- 694 Rutland Rd Unit Building
- 688 Rutland Rd
- 698 Rutland Rd
- 698 Rutland Rd
- 698 Rutland Rd
- 684 Rutland Rd
- 682 Rutland Rd
- 700 Rutland Rd
- 680 Rutland Rd
- 739 Fenimore St Unit 1 B
- 741 Fenimore St
- 741 Fenimore St Unit 2
- 741 Fenimore St Unit 4A