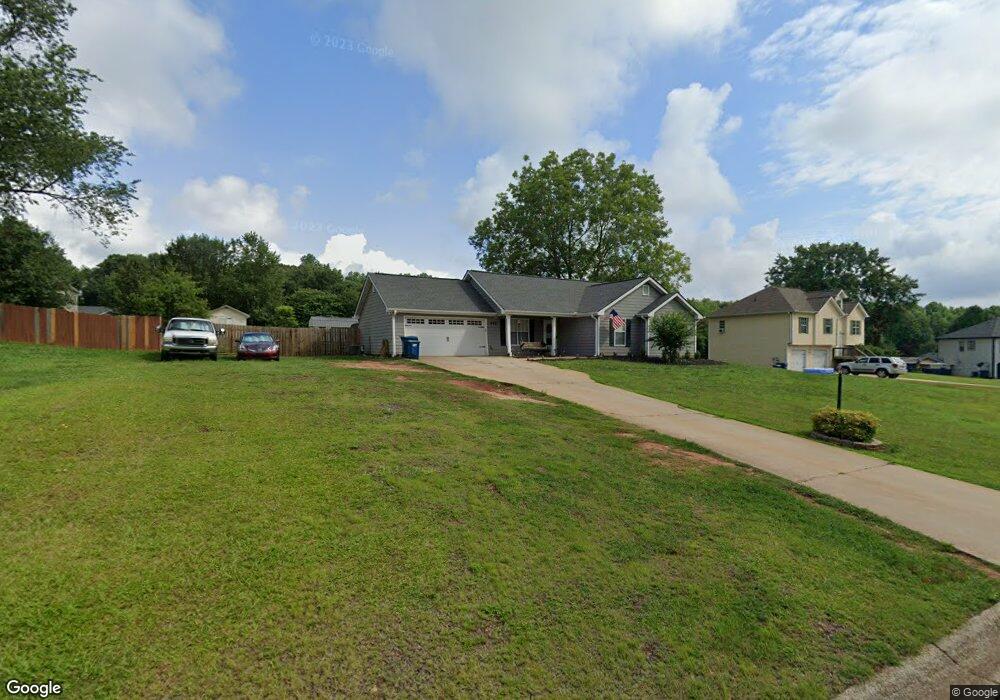
692 Thorn Brook Ridge Bethlehem, GA 30620
Estimated Value: $280,273 - $301,000
3
Beds
2
Baths
1,248
Sq Ft
$232/Sq Ft
Est. Value
About This Home
This home is located at 692 Thorn Brook Ridge, Bethlehem, GA 30620 and is currently estimated at $290,068, approximately $232 per square foot. 692 Thorn Brook Ridge is a home located in Barrow County with nearby schools including Bethlehem Elementary School, Haymon-Morris Middle School, and Apalachee High School.
Ownership History
Date
Name
Owned For
Owner Type
Purchase Details
Closed on
Nov 29, 2001
Sold by
Kennedy Kevin
Bought by
Kennedy Kevin
Current Estimated Value
Home Financials for this Owner
Home Financials are based on the most recent Mortgage that was taken out on this home.
Original Mortgage
$112,106
Outstanding Balance
$43,578
Interest Rate
6.5%
Mortgage Type
New Conventional
Estimated Equity
$246,490
Purchase Details
Closed on
Aug 30, 2000
Sold by
Kennedy Kevin And
Bought by
Kennedy Kevin
Home Financials for this Owner
Home Financials are based on the most recent Mortgage that was taken out on this home.
Original Mortgage
$99,750
Interest Rate
8.17%
Mortgage Type
New Conventional
Purchase Details
Closed on
Jan 9, 1998
Sold by
Vonjackson Construct
Bought by
Kennedy Kevin and Jones Aimee
Home Financials for this Owner
Home Financials are based on the most recent Mortgage that was taken out on this home.
Original Mortgage
$82,740
Interest Rate
7.18%
Mortgage Type
New Conventional
Purchase Details
Closed on
Mar 13, 1997
Sold by
Hu Ka Builders Inc
Bought by
Construc Vonjackson
Create a Home Valuation Report for This Property
The Home Valuation Report is an in-depth analysis detailing your home's value as well as a comparison with similar homes in the area
Home Values in the Area
Average Home Value in this Area
Purchase History
| Date | Buyer | Sale Price | Title Company |
|---|---|---|---|
| Kennedy Kevin | -- | -- | |
| Kennedy Kevin | -- | -- | |
| Kennedy Kevin | $82,000 | -- | |
| Construc Vonjackson | $16,500 | -- |
Source: Public Records
Mortgage History
| Date | Status | Borrower | Loan Amount |
|---|---|---|---|
| Open | Kennedy Kevin | $112,106 | |
| Closed | Kennedy Kevin | $112,106 | |
| Previous Owner | Kennedy Kevin | $99,750 | |
| Previous Owner | Kennedy Kevin | $82,740 |
Source: Public Records
Tax History Compared to Growth
Tax History
| Year | Tax Paid | Tax Assessment Tax Assessment Total Assessment is a certain percentage of the fair market value that is determined by local assessors to be the total taxable value of land and additions on the property. | Land | Improvement |
|---|---|---|---|---|
| 2024 | $1,637 | $67,040 | $17,200 | $49,840 |
| 2023 | $1,192 | $67,040 | $17,200 | $49,840 |
| 2022 | $1,774 | $63,610 | $17,200 | $46,410 |
| 2021 | $1,831 | $61,610 | $15,200 | $46,410 |
| 2020 | $1,595 | $53,958 | $12,000 | $41,958 |
| 2019 | $1,474 | $49,505 | $12,000 | $37,505 |
| 2018 | $1,374 | $46,621 | $10,600 | $36,021 |
| 2017 | $1,116 | $38,330 | $9,000 | $29,330 |
| 2016 | $1,069 | $37,802 | $13,000 | $24,802 |
| 2015 | $1,090 | $38,390 | $13,000 | $25,390 |
| 2014 | $840 | $32,054 | $6,370 | $25,684 |
| 2013 | -- | $30,830 | $6,370 | $24,460 |
Source: Public Records
Map
Nearby Homes
- 966 David Ave
- 724 Manger Ave
- 0 Manger Ave E Unit 20154677
- 0 Manger Ave E Unit 20127001
- 898 Harrison Mill Rd
- 784 Manger Ave
- 0 Monroe Hwy Unit 10466108
- 0 Monroe Hwy Unit 7530054
- 1050 Bethlehem Church Rd
- 164 Manning Gin Rd
- 204 Nativity Cove
- 328 Advent Dr
- 182 Nativity Cove
- 528 Harris Dr
- 449 & 455 Carl-Bethlehem Rd
- 0 Harrison Mill Rd Unit 10522698
- 303 Carly Ct
- 0 McElhannon Rd SW Unit 10581793
- 213 Harvey Lokey Rd
- 755 Harry McCarty Rd
- 688 Thorn Brook Ridge
- 696 Thorn Brook Ridge
- 0 Thorn Brook Ridge 0
- 257 Thorn Brook Cir
- 255 Thorn Brook Cir
- 259 Thorn Brook Cir
- 686 Thorn Brook Ridge
- 693 Thorn Brook Ridge
- 702 Thorn Brook Ridge
- 689 Thorn Brook Ridge
- 253 Thorn Brook Cir
- 265 Thorn Brook Cir
- 695 Thorn Brook Ridge
- 685 Thorn Brook Ridge
- 0 Thorn Brook Cir Unit 8853348
- 0 Thorn Brook Cir Unit 8605533
- 0 Thorn Brook Cir Unit 9001055
- 0 Thorn Brook Cir Unit 8827227
- 0 Thorn Brook Cir Unit 8852567