Estimated Value: $610,000 - $955,000
3
Beds
2
Baths
1,809
Sq Ft
$435/Sq Ft
Est. Value
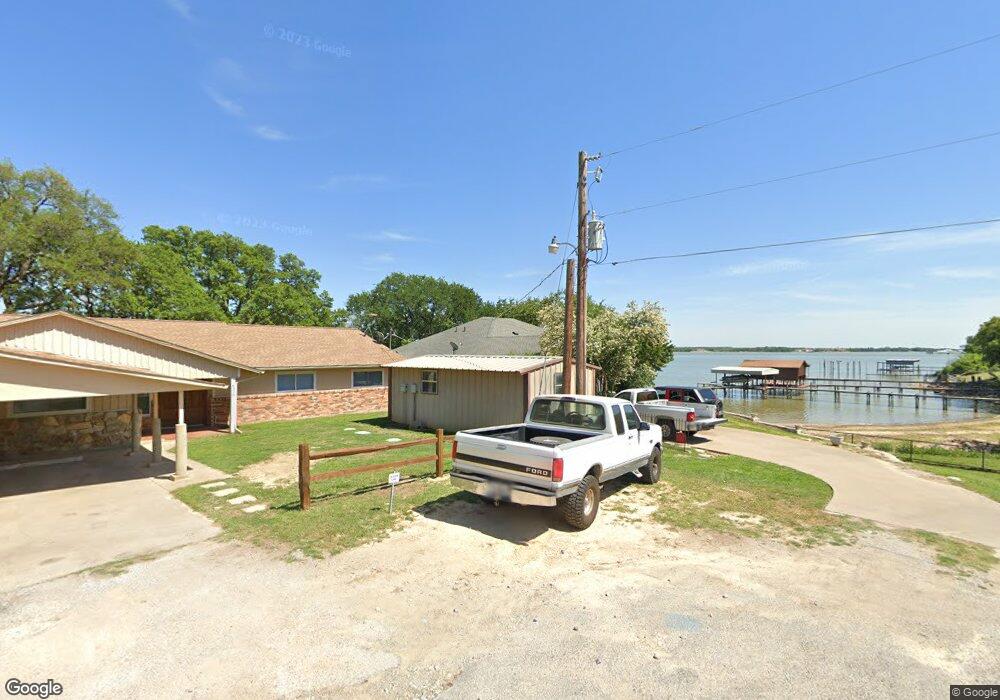
About This Home
This home is located at 6920 Quarteroaks Dr, Azle, TX 76020 and is currently estimated at $786,938, approximately $435 per square foot. 6920 Quarteroaks Dr is a home located in Tarrant County with nearby schools including Liberty Elementary School, W E Hoover Elementary School, and Santo Forte Junior High School.
Ownership History
Date
Name
Owned For
Owner Type
Purchase Details
Closed on
Sep 1, 1999
Sold by
Mielke Scott Alan
Bought by
Holmes James R and Holmes Jeanne F
Current Estimated Value
Home Financials for this Owner
Home Financials are based on the most recent Mortgage that was taken out on this home.
Original Mortgage
$80,000
Interest Rate
7.9%
Mortgage Type
Purchase Money Mortgage
Purchase Details
Closed on
Oct 10, 1997
Sold by
Prochaska George R and Prochaska Darlene G
Bought by
Mielke Scott Alan
Home Financials for this Owner
Home Financials are based on the most recent Mortgage that was taken out on this home.
Original Mortgage
$125,000
Interest Rate
7.54%
Purchase Details
Closed on
Jun 10, 1996
Sold by
Schiffers Peter H
Bought by
Schiffers Margaret S
Create a Home Valuation Report for This Property
The Home Valuation Report is an in-depth analysis detailing your home's value as well as a comparison with similar homes in the area
Home Values in the Area
Average Home Value in this Area
Purchase History
| Date | Buyer | Sale Price | Title Company |
|---|---|---|---|
| Holmes James R | -- | Commerce Land Title | |
| Mielke Scott Alan | -- | Commerce Land Title Inc | |
| Schiffers Margaret S | -- | -- |
Source: Public Records
Mortgage History
| Date | Status | Borrower | Loan Amount |
|---|---|---|---|
| Previous Owner | Holmes James R | $80,000 | |
| Previous Owner | Mielke Scott Alan | $125,000 |
Source: Public Records
Tax History Compared to Growth
Tax History
| Year | Tax Paid | Tax Assessment Tax Assessment Total Assessment is a certain percentage of the fair market value that is determined by local assessors to be the total taxable value of land and additions on the property. | Land | Improvement |
|---|---|---|---|---|
| 2025 | $3,157 | $907,295 | $490,487 | $416,808 |
| 2024 | $3,157 | $907,295 | $490,487 | $416,808 |
| 2023 | $9,194 | $766,231 | $490,487 | $275,744 |
| 2022 | $9,745 | $514,354 | $133,142 | $381,212 |
| 2021 | $9,095 | $491,376 | $133,142 | $358,234 |
| 2020 | $8,268 | $424,768 | $133,142 | $291,626 |
| 2019 | $8,275 | $408,540 | $133,142 | $275,398 |
| 2018 | $5,280 | $389,262 | $133,142 | $256,120 |
| 2017 | $7,265 | $410,329 | $150,000 | $260,329 |
| 2016 | $6,604 | $342,366 | $150,000 | $192,366 |
| 2015 | $5,252 | $361,800 | $150,000 | $211,800 |
| 2014 | $5,252 | $361,800 | $150,000 | $211,800 |
Source: Public Records
Map
Nearby Homes
- 13730 Williams Rd
- 6955 Allyn Dr
- 13360 Miller Rd
- 13350 Miller Rd
- 13690 Liberty School Rd
- 7232 Courtney Dr
- 13250 Miller Rd
- 13230 Miller Rd
- 7218 Alcove St
- 7047 Alcove St
- 7037 Camp St
- 14070 Rucker St
- 7071 Darling St
- 14095 Liberty School Rd
- 7118 Rucker St
- 7219 Rucker St
- #7 Tbd Briar Rd
- 6827 Briar Rd
- 6811 Briar Rd
- 6870 Briar Rd
- 6916 Quarteroaks Dr
- 6912 Quarteroaks Dr
- 6908 Quarteroaks Dr
- 13590 Williams Rd
- 13590 Williams Rd
- 6906 Quarteroaks Dr
- 13580 Williams Rd
- 6902 Quarteroaks Dr
- 13630 Williams Rd
- 13570 Williams Rd
- 6904 Quarteroaks Dr
- 13660 Williams Rd
- 13560 Williams Rd
- 13605 Williams Rd
- 13680 Williams Rd
- 13665 Williams Rd
- 13550 Williams Rd
- 13710 Williams Rd
- 13510 Williams Rd
- 13585 Williams Rd