Estimated Value: $125,013 - $156,000
2
Beds
1
Bath
900
Sq Ft
$157/Sq Ft
Est. Value
About This Home
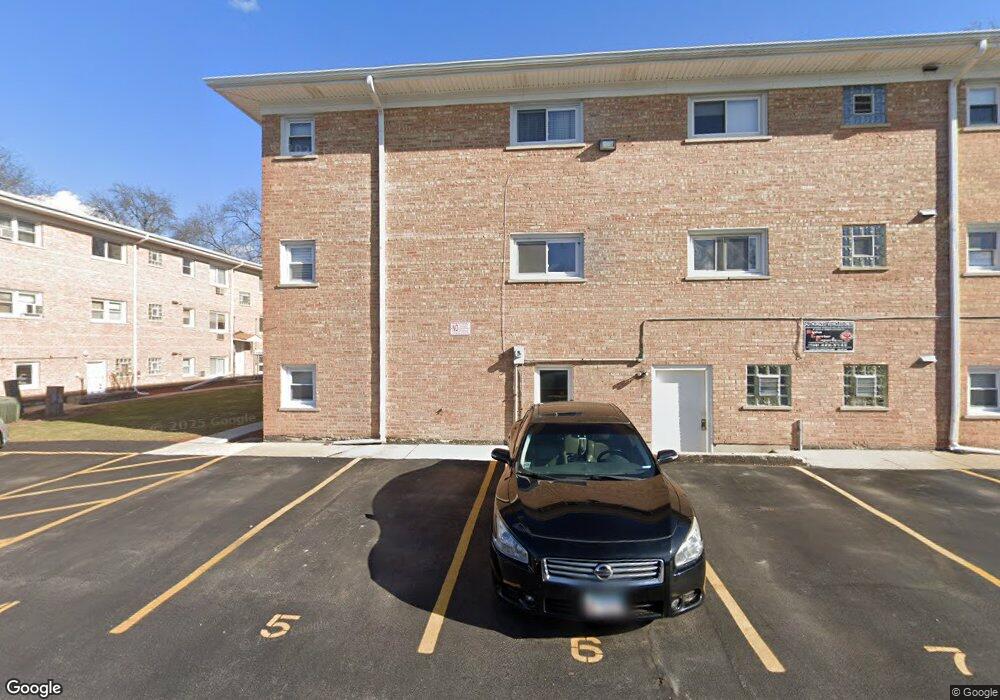
This home is located at 6920 W 109th St Unit 69202A, Worth, IL 60482 and is currently estimated at $141,253, approximately $156 per square foot. 6920 W 109th St Unit 69202A is a home located in Cook County with nearby schools including Worth Elementary School, Worth Jr High School, and A B Shepard High School.
Ownership History
Date
Name
Owned For
Owner Type
Purchase Details
Closed on
Mar 6, 2012
Sold by
Bourjas Dany
Bought by
Chicago Title Land Trust and Trust #8002358898
Current Estimated Value
Purchase Details
Closed on
Feb 17, 2012
Sold by
Bryniarska Cecylia
Bought by
Bourjas Dany
Purchase Details
Closed on
Aug 3, 2007
Sold by
Bryniarska Janina
Bought by
Bryniarska Weronika and Bryniarska Cecylia
Home Financials for this Owner
Home Financials are based on the most recent Mortgage that was taken out on this home.
Original Mortgage
$105,600
Interest Rate
6.71%
Mortgage Type
New Conventional
Purchase Details
Closed on
Mar 14, 2007
Sold by
Lode Conversion Llc
Bought by
Bryniarska Janina
Home Financials for this Owner
Home Financials are based on the most recent Mortgage that was taken out on this home.
Original Mortgage
$84,600
Interest Rate
6.12%
Mortgage Type
Unknown
Create a Home Valuation Report for This Property
The Home Valuation Report is an in-depth analysis detailing your home's value as well as a comparison with similar homes in the area
Home Values in the Area
Average Home Value in this Area
Purchase History
| Date | Buyer | Sale Price | Title Company |
|---|---|---|---|
| Chicago Title Land Trust | $38,000 | Cti | |
| Bourjas Dany | $22,000 | None Available | |
| Bryniarska Weronika | $132,000 | Git | |
| Bryniarska Janina | $94,000 | Cti |
Source: Public Records
Mortgage History
| Date | Status | Borrower | Loan Amount |
|---|---|---|---|
| Previous Owner | Bryniarska Weronika | $105,600 | |
| Previous Owner | Bryniarska Janina | $84,600 |
Source: Public Records
Tax History Compared to Growth
Tax History
| Year | Tax Paid | Tax Assessment Tax Assessment Total Assessment is a certain percentage of the fair market value that is determined by local assessors to be the total taxable value of land and additions on the property. | Land | Improvement |
|---|---|---|---|---|
| 2024 | $2,151 | $9,324 | $1,349 | $7,975 |
| 2023 | $1,338 | $9,323 | $1,348 | $7,975 |
| 2022 | $1,338 | $6,593 | $1,876 | $4,717 |
| 2021 | $1,324 | $6,593 | $1,876 | $4,717 |
| 2020 | $1,385 | $6,593 | $1,876 | $4,717 |
| 2019 | $1,146 | $6,159 | $1,700 | $4,459 |
| 2018 | $1,138 | $6,159 | $1,700 | $4,459 |
| 2017 | $1,879 | $7,874 | $1,700 | $6,174 |
| 2016 | $1,480 | $5,805 | $1,407 | $4,398 |
| 2015 | $1,398 | $5,805 | $1,407 | $4,398 |
| 2014 | $604 | $5,805 | $1,407 | $4,398 |
| 2013 | $2,465 | $8,982 | $1,407 | $7,575 |
Source: Public Records
Map
Nearby Homes
- 10930 S Worth Ave Unit 5
- 10940 S Worth Ave Unit 1094011
- 10817 S Oak Park Ave
- 6806 W Lode Dr Unit 1B
- 6737 W Lloyd Dr
- 10718 S Worth Ave
- 10815 S 71st Ct
- 10811 S Lloyd Dr Unit 2
- 10735 S Lloyd Dr
- 7201 W 110th St
- 10600 S Highland Ave
- 7110 W 107th St Unit 16
- 7213 W 109th St
- 10609 Southwest Hwy Unit 2A
- 7248 W 110th St
- 11201 S Normandy Ave
- 10701 S Nashville Ave
- 10910 S Natchez Ave
- 10504 S Highland Ave Unit 1A
- 11258 S Normandy Ave
- 6920 W 109th St Unit 69203B
- 6920 W 109th St Unit 69202B
- 6920 W 109th St Unit 69201B
- 6920 W 109th St Unit 69201A
- 6920 W 109th St Unit 69203A
- 6920 W 109th St Unit 2B
- 6920 W 109th St Unit 1A
- 6920 W 109th St Unit 1B
- 6920 W 109th St Unit 3B
- 6930 W 109th St Unit 1B
- 6930 W 109th St Unit 69303B
- 6930 W 109th St Unit 69303A
- 6930 W 109th St Unit 69302B
- 6930 W 109th St Unit 69302A
- 6930 W 109th St Unit 69301A
- 6930 W 109th St Unit 69301B
- 6930 W 109th St Unit 3B
- 6930 W 109th St Unit 2B
- 6930 W 109th St Unit 2A
- 6940 W 109th St Unit 69403A