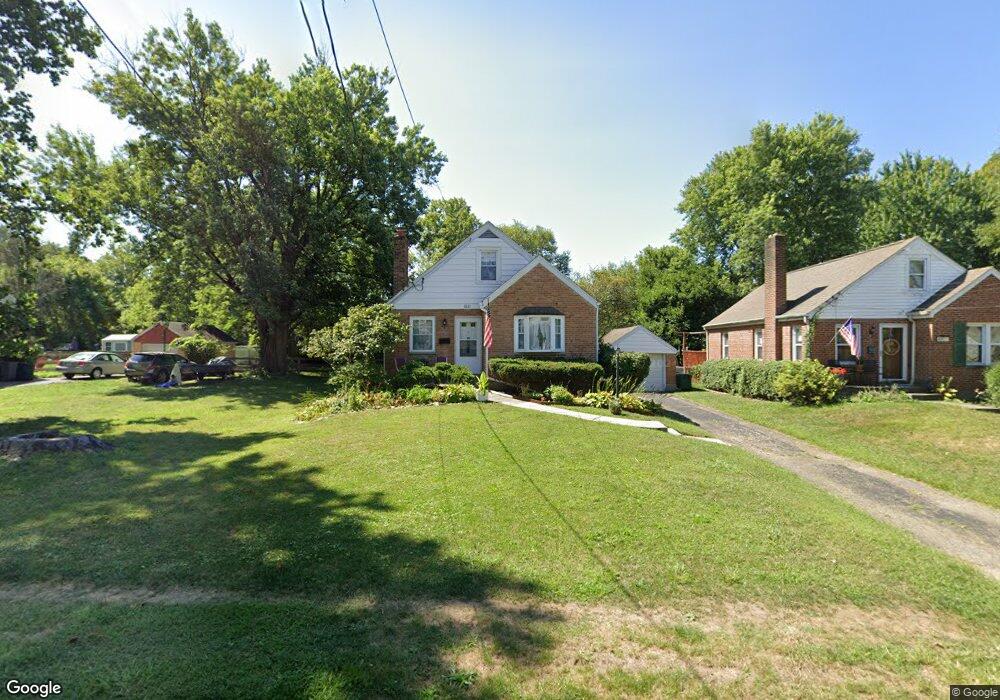
6921 Jefferson St Cincinnati, OH 45244
Estimated Value: $206,227 - $225,000
3
Beds
1
Bath
1,031
Sq Ft
$211/Sq Ft
Est. Value
About This Home
This home is located at 6921 Jefferson St, Cincinnati, OH 45244 and is currently estimated at $217,307, approximately $210 per square foot. 6921 Jefferson St is a home located in Hamilton County with nearby schools including Mercer Elementary School, Nagel Middle School, and Turpin High School.
Ownership History
Date
Name
Owned For
Owner Type
Purchase Details
Closed on
Nov 20, 2009
Sold by
Harrison Jerri L
Bought by
Packer Dawn R
Current Estimated Value
Home Financials for this Owner
Home Financials are based on the most recent Mortgage that was taken out on this home.
Original Mortgage
$99,750
Outstanding Balance
$64,799
Interest Rate
4.9%
Mortgage Type
Unknown
Estimated Equity
$152,508
Purchase Details
Closed on
Jul 31, 2003
Sold by
Balmos Christina Schaefer
Bought by
Harrison Jerri L
Home Financials for this Owner
Home Financials are based on the most recent Mortgage that was taken out on this home.
Original Mortgage
$112,575
Interest Rate
5.47%
Mortgage Type
Unknown
Purchase Details
Closed on
Jul 20, 1999
Sold by
Balmos Victor S
Bought by
Balmos Christine Schaefer
Home Financials for this Owner
Home Financials are based on the most recent Mortgage that was taken out on this home.
Original Mortgage
$84,000
Interest Rate
7.61%
Purchase Details
Closed on
Feb 10, 1999
Sold by
Balmos Victor S
Bought by
Balmos Victor S and Victor S Balmos Trust
Create a Home Valuation Report for This Property
The Home Valuation Report is an in-depth analysis detailing your home's value as well as a comparison with similar homes in the area
Home Values in the Area
Average Home Value in this Area
Purchase History
| Date | Buyer | Sale Price | Title Company |
|---|---|---|---|
| Packer Dawn R | $105,000 | Attorney | |
| Harrison Jerri L | $118,500 | -- | |
| Balmos Christine Schaefer | $97,500 | -- | |
| Balmos Victor S | -- | -- |
Source: Public Records
Mortgage History
| Date | Status | Borrower | Loan Amount |
|---|---|---|---|
| Open | Packer Dawn R | $99,750 | |
| Previous Owner | Harrison Jerri L | $112,575 | |
| Previous Owner | Balmos Christine Schaefer | $84,000 |
Source: Public Records
Tax History Compared to Growth
Tax History
| Year | Tax Paid | Tax Assessment Tax Assessment Total Assessment is a certain percentage of the fair market value that is determined by local assessors to be the total taxable value of land and additions on the property. | Land | Improvement |
|---|---|---|---|---|
| 2024 | $2,661 | $47,786 | $8,750 | $39,036 |
| 2023 | $2,674 | $47,786 | $8,750 | $39,036 |
| 2022 | $2,212 | $35,256 | $8,005 | $27,251 |
| 2021 | $2,154 | $35,256 | $8,005 | $27,251 |
| 2020 | $2,182 | $35,256 | $8,005 | $27,251 |
| 2019 | $2,172 | $32,050 | $7,277 | $24,773 |
| 2018 | $2,029 | $32,050 | $7,277 | $24,773 |
| 2017 | $1,925 | $32,050 | $7,277 | $24,773 |
| 2016 | $2,282 | $37,118 | $7,000 | $30,118 |
| 2015 | $2,355 | $37,118 | $7,000 | $30,118 |
| 2014 | $2,357 | $37,118 | $7,000 | $30,118 |
| 2013 | $2,196 | $36,750 | $6,930 | $29,820 |
Source: Public Records
Map
Nearby Homes
- 6809 Jefferson St
- 7050 Olentangy Ln
- 7160 English Dr Unit 2303
- 7124 Thorndale Ln
- 7222 English Dr Unit 6305
- 6721 Linder Ln
- 6196 Turpin Hills Dr
- 2669 Newtown Rd
- 2708 Caledon Ln
- 7976 Ashley View Dr
- 6557 Copperleaf Ln
- 2560 Coveyrun Ct
- 7481 Heatherwood Ln
- 2455 Rainbow Ct
- 3742 Miami Run
- 3746 Miami Run
- 3750 Miami Run
- 3763 Miami Run
- 3767 Miami Run
- 3758 Miami Run
- 6919 Jefferson St
- 6925 Jefferson St
- 6915 Jefferson St
- 6915 Jefferson St
- 6922 Edith St
- 6924 Edith St
- 3309 Pine St
- 6920 Edith St
- 6926 Edith St
- 3311 Pine St
- 6918 Edith St
- 6913 Jefferson St
- 6920 Jefferson St
- 6928 Edith St
- 6922 Jefferson St
- 6918 Jefferson St
- 6924 Jefferson St
- 6916 Edith St
- 6916 Jefferson St
- 6928 Jefferson St