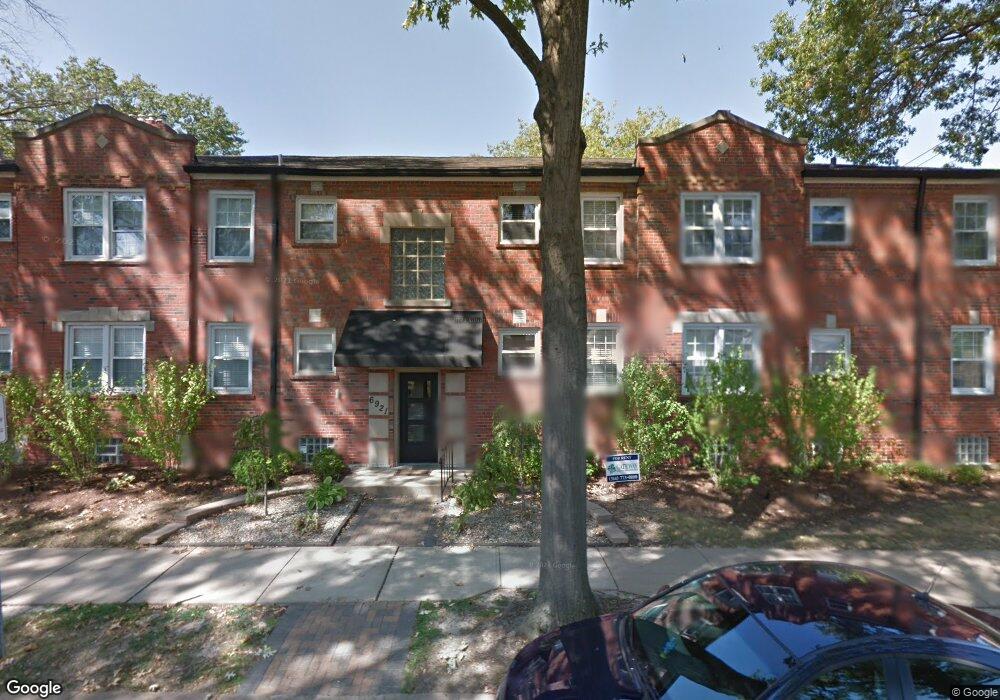
6921 Southland Ave Saint Louis, MO 63109
Saint Louis Hills NeighborhoodEstimated Value: $129,391 - $150,000
--
Bed
1
Bath
780
Sq Ft
$175/Sq Ft
Est. Value
About This Home
This home is located at 6921 Southland Ave, Saint Louis, MO 63109 and is currently estimated at $136,598, approximately $175 per square foot. 6921 Southland Ave is a home located in St. Louis City with nearby schools including Buder Elementary School, Long International Middle School, and Roosevelt High School.
Ownership History
Date
Name
Owned For
Owner Type
Purchase Details
Closed on
Sep 26, 2019
Sold by
Malle Anthony Thomas and Malle Samantha
Bought by
Schulte Karen A
Current Estimated Value
Home Financials for this Owner
Home Financials are based on the most recent Mortgage that was taken out on this home.
Original Mortgage
$53,000
Outstanding Balance
$46,431
Interest Rate
3.5%
Mortgage Type
New Conventional
Estimated Equity
$90,167
Purchase Details
Closed on
Sep 18, 2007
Sold by
Jacco Group Llc
Bought by
Malle J Thomas J and Malle Jude Thomas
Home Financials for this Owner
Home Financials are based on the most recent Mortgage that was taken out on this home.
Original Mortgage
$112,500
Interest Rate
6.66%
Mortgage Type
Purchase Money Mortgage
Purchase Details
Closed on
May 23, 2000
Sold by
Southland Condominium Assn Inc
Bought by
Lynch Rose Marie
Purchase Details
Closed on
Apr 20, 2000
Sold by
Southland Condominium Assn Inc
Bought by
Lynch Rose Marie
Create a Home Valuation Report for This Property
The Home Valuation Report is an in-depth analysis detailing your home's value as well as a comparison with similar homes in the area
Home Values in the Area
Average Home Value in this Area
Purchase History
| Date | Buyer | Sale Price | Title Company |
|---|---|---|---|
| Schulte Karen A | $97,000 | Investors Title Company | |
| Malle J Thomas J | -- | Mutliple | |
| Lynch Rose Marie | -- | -- | |
| Lynch Rose Marie | -- | -- |
Source: Public Records
Mortgage History
| Date | Status | Borrower | Loan Amount |
|---|---|---|---|
| Open | Schulte Karen A | $53,000 | |
| Previous Owner | Malle J Thomas J | $112,500 |
Source: Public Records
Tax History Compared to Growth
Tax History
| Year | Tax Paid | Tax Assessment Tax Assessment Total Assessment is a certain percentage of the fair market value that is determined by local assessors to be the total taxable value of land and additions on the property. | Land | Improvement |
|---|---|---|---|---|
| 2025 | $1,633 | $20,050 | -- | $20,050 |
| 2024 | $1,557 | $18,400 | -- | $18,400 |
| 2023 | $1,557 | $18,400 | $0 | $18,400 |
| 2022 | $1,450 | $17,200 | $0 | $17,200 |
| 2021 | $1,448 | $17,200 | $0 | $17,200 |
| 2020 | $1,437 | $17,200 | $0 | $17,200 |
| 2019 | $1,432 | $17,200 | $0 | $17,200 |
| 2018 | $1,476 | $17,200 | $0 | $17,200 |
| 2017 | $1,451 | $17,200 | $0 | $17,200 |
| 2016 | $1,470 | $17,200 | $0 | $17,200 |
| 2015 | $1,333 | $17,200 | $0 | $17,200 |
| 2014 | $1,333 | $17,200 | $0 | $17,200 |
| 2013 | -- | $17,200 | $0 | $17,200 |
Source: Public Records
Map
Nearby Homes
- 6921 Southland Ave Unit C
- 5845 Robert Ave
- 5855 Robert Ave
- 6415 Blow St
- 5872 Sunshine Dr Unit 110
- 5812 Sunshine Dr
- 5404 Nagel Ave
- 5345 Quincy St
- 5811 Finkman St
- 5909 Hampton Ave
- 5536 Lisette Ave
- 5300 Loughborough Ave
- 5728 Holly Hills Ave
- 5230 Sunshine Dr
- 5454 Lisette Ave
- 5505 Lisette Ave
- 5231 Bonita Ave
- 5515 Finkman St
- 5203 Schollmeyer Ave
- 5740 Milentz Ave
- 6921 Southland Ave
- 6921 Southland Ave
- 6921 Southland Ave
- 6921 Southland Ave
- 6921 Southland Ave
- 6921 Southland Ave
- 6921 Southland Ave
- 6921 Southland Ave Unit A
- 6921 Southland Ave Unit H
- 6921 Southland Ave Unit E
- 6921 Southland Ave Unit D
- 6921 Southland Ave Unit B
- 6924 Southland Ave
- 6912 Southland Ave
- 5919 Nagel Ave Unit D
- 5919 Nagel Ave
- 5919 Nagel Ave Unit B
- 5919 Nagel Ave Unit H
- 5919 Nagel Ave Unit G
- 5900 Loughborough Ave