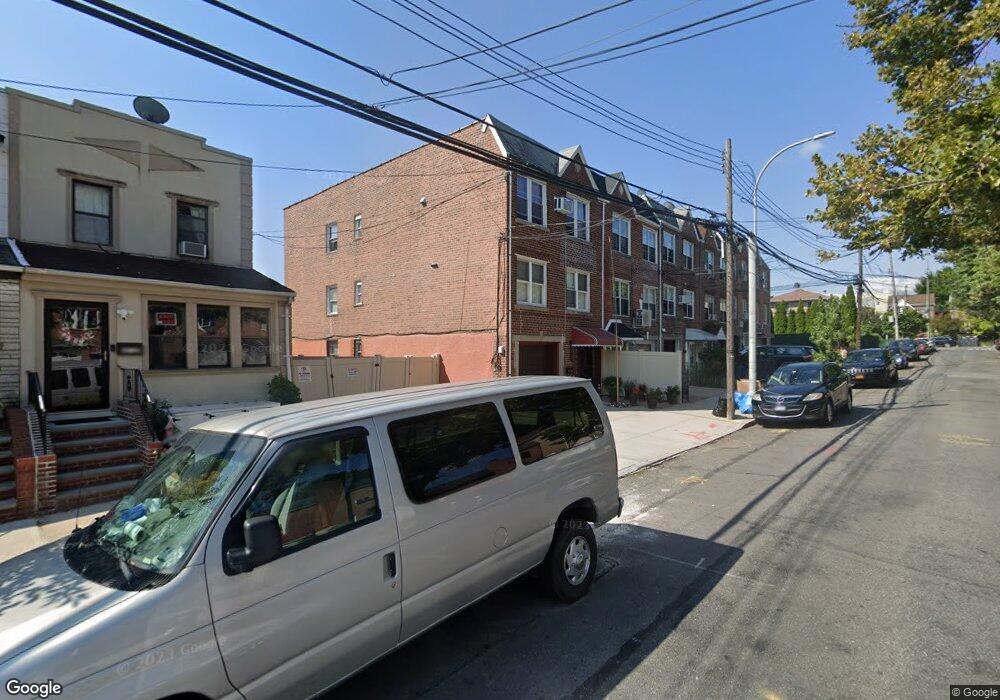
6922 53rd Ave Maspeth, NY 11378
Maspeth NeighborhoodEstimated Value: $1,344,748 - $1,485,000
--
Bed
--
Bath
2,680
Sq Ft
$526/Sq Ft
Est. Value
About This Home
This home is located at 6922 53rd Ave, Maspeth, NY 11378 and is currently estimated at $1,410,687, approximately $526 per square foot. 6922 53rd Ave is a home located in Queens County with nearby schools including Ps 58 School Of Heroes, IS 73 - The Frank Sansivieri School, and Grover Cleveland High School.
Ownership History
Date
Name
Owned For
Owner Type
Purchase Details
Closed on
May 26, 2022
Sold by
Gao Liang and Gao Xue Qin
Bought by
Gao Xue Qin
Current Estimated Value
Purchase Details
Closed on
Sep 30, 2013
Sold by
Angela Vouniseas As Trustee
Bought by
Gao Liang and Gao Xue Qin
Home Financials for this Owner
Home Financials are based on the most recent Mortgage that was taken out on this home.
Original Mortgage
$503,000
Outstanding Balance
$378,845
Interest Rate
4.56%
Mortgage Type
New Conventional
Estimated Equity
$1,031,842
Create a Home Valuation Report for This Property
The Home Valuation Report is an in-depth analysis detailing your home's value as well as a comparison with similar homes in the area
Home Values in the Area
Average Home Value in this Area
Purchase History
| Date | Buyer | Sale Price | Title Company |
|---|---|---|---|
| Gao Xue Qin | $775,777 | -- | |
| Gao Liang | $800,000 | -- |
Source: Public Records
Mortgage History
| Date | Status | Borrower | Loan Amount |
|---|---|---|---|
| Open | Gao Liang | $503,000 |
Source: Public Records
Tax History Compared to Growth
Tax History
| Year | Tax Paid | Tax Assessment Tax Assessment Total Assessment is a certain percentage of the fair market value that is determined by local assessors to be the total taxable value of land and additions on the property. | Land | Improvement |
|---|---|---|---|---|
| 2025 | $11,054 | $55,037 | $7,413 | $47,624 |
| 2024 | $11,054 | $55,037 | $7,755 | $47,282 |
| 2023 | $10,635 | $52,950 | $6,921 | $46,029 |
| 2022 | $9,628 | $75,120 | $11,160 | $63,960 |
| 2021 | $9,572 | $65,940 | $11,160 | $54,780 |
| 2020 | $9,049 | $66,900 | $11,160 | $55,740 |
| 2019 | $8,935 | $66,000 | $11,160 | $54,840 |
| 2018 | $8,336 | $44,125 | $9,554 | $34,571 |
| 2017 | $8,108 | $42,943 | $8,217 | $34,726 |
| 2016 | $7,478 | $42,943 | $8,217 | $34,726 |
| 2015 | $2,071 | $38,220 | $12,420 | $25,800 |
| 2014 | $2,071 | $38,220 | $12,420 | $25,800 |
Source: Public Records
Map
Nearby Homes