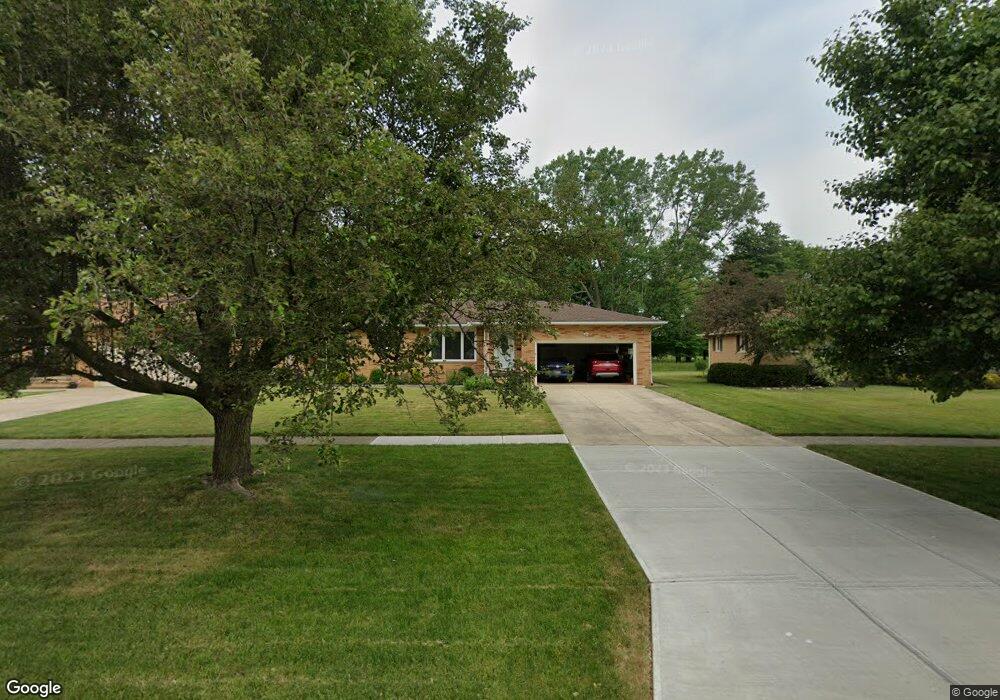
6922 Middlebrook Blvd Middleburg Heights, OH 44130
Estimated Value: $255,839 - $340,000
3
Beds
2
Baths
1,352
Sq Ft
$215/Sq Ft
Est. Value
About This Home
This home is located at 6922 Middlebrook Blvd, Middleburg Heights, OH 44130 and is currently estimated at $290,710, approximately $215 per square foot. 6922 Middlebrook Blvd is a home located in Cuyahoga County with nearby schools including Big Creek Elementary School, Berea-Midpark Middle School, and Berea-Midpark High School.
Ownership History
Date
Name
Owned For
Owner Type
Purchase Details
Closed on
Apr 7, 2014
Sold by
Salsbury Garry W and Salsbury Louise A
Bought by
Salsbury Garry W and Salsbury Louise A
Current Estimated Value
Purchase Details
Closed on
Sep 30, 1993
Sold by
Salsbury Garry W
Bought by
Salsbury Garry W and Salsbury Trs.
Purchase Details
Closed on
Jun 3, 1987
Sold by
Specht Virginia S
Bought by
Salsbury Garry W
Purchase Details
Closed on
Aug 17, 1984
Sold by
Specht Virginia and Specht Norbert S
Bought by
Specht Virginia S
Purchase Details
Closed on
May 9, 1979
Sold by
Batovsky Virginia M
Bought by
Specht Virginia and Specht Norbert S
Purchase Details
Closed on
Jun 14, 1976
Sold by
Batovsky Michael J and V M
Bought by
Batovsky Virginia M
Purchase Details
Closed on
Jan 1, 1975
Bought by
Batovsky Michael J and Batovsky M
Create a Home Valuation Report for This Property
The Home Valuation Report is an in-depth analysis detailing your home's value as well as a comparison with similar homes in the area
Home Values in the Area
Average Home Value in this Area
Purchase History
| Date | Buyer | Sale Price | Title Company |
|---|---|---|---|
| Salsbury Garry W | -- | Attorney | |
| Salsbury Garry W | -- | -- | |
| Salsbury Garry W | $83,000 | -- | |
| Specht Virginia S | -- | -- | |
| Specht Virginia | -- | -- | |
| Batovsky Virginia M | $24,000 | -- | |
| Batovsky Michael J | -- | -- |
Source: Public Records
Tax History Compared to Growth
Tax History
| Year | Tax Paid | Tax Assessment Tax Assessment Total Assessment is a certain percentage of the fair market value that is determined by local assessors to be the total taxable value of land and additions on the property. | Land | Improvement |
|---|---|---|---|---|
| 2024 | $3,796 | $81,095 | $17,955 | $63,140 |
| 2023 | $3,370 | $61,220 | $14,740 | $46,480 |
| 2022 | $3,902 | $61,220 | $14,740 | $46,480 |
| 2021 | $3,880 | $61,220 | $14,740 | $46,480 |
| 2020 | $3,805 | $52,780 | $12,710 | $40,080 |
| 2019 | $3,697 | $150,800 | $36,300 | $114,500 |
| 2018 | $3,682 | $52,780 | $12,710 | $40,080 |
| 2017 | $3,630 | $48,020 | $11,690 | $36,330 |
| 2016 | $3,601 | $48,020 | $11,690 | $36,330 |
| 2015 | $3,392 | $48,020 | $11,690 | $36,330 |
| 2014 | $3,392 | $48,020 | $11,690 | $36,330 |
Source: Public Records
Map
Nearby Homes
- 15510 Sandalhaven Dr
- 15983 Galemore Dr
- 6809 Meadow Ln
- 6689 Fry Rd
- 6823 Fry Rd
- 6736 Rockridge Ct
- 6736 Columbine Ct
- 15490 Oakshire Ct
- 6710 Woodruff Ct
- 16761 Orchard Grove Dr Unit 6808A
- 16147 Ramona Dr
- 6749 Middlebrook Blvd
- 6724 Benedict Dr
- 6771 Wood Creek Dr
- 6720 Benedict Dr
- 6744 Benedict Dr
- 6748 Benedict Dr
- 16259 Emerald Point Unit 16259
- 15446 Sheldon Rd
- 6755 Benedict Dr
- 6928 Middlebrook Blvd
- 6916 Middlebrook Blvd
- 6910 Middlebrook Blvd
- 6934 Middlebrook Blvd
- 6940 Middlebrook Blvd
- 15756 Sandalhaven Dr
- 6900 Middlebrook Blvd
- 6946 Middlebrook Blvd
- 6921 Middlebrook Blvd
- 6915 Middlebrook Blvd
- 15728 Sandalhaven Dr
- 6909 Middlebrook Blvd
- 6892 Middlebrook Blvd
- 6952 Middlebrook Blvd
- 6903 Middlebrook Blvd
- 15759 Sandalhaven Dr
- 15700 Sandalhaven Dr
- 6897 Middlebrook Blvd
- 15731 Sandalhaven Dr
- 6886 Middlebrook Blvd