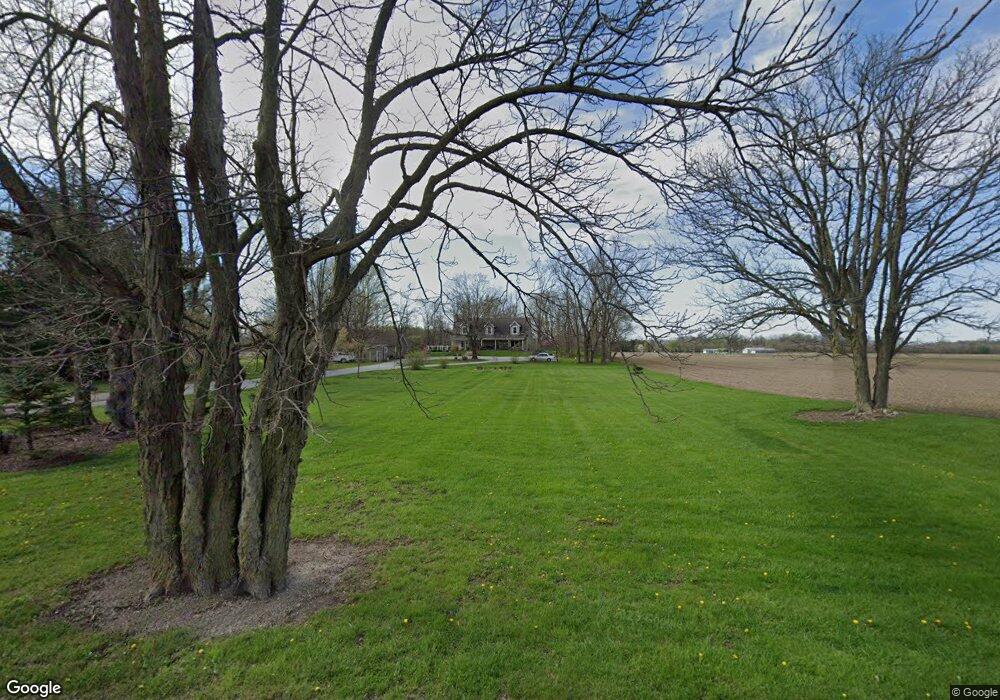
6923 W 100 S Anderson, IN 46011
Estimated Value: $295,000 - $514,301
3
Beds
3
Baths
2,912
Sq Ft
$132/Sq Ft
Est. Value
About This Home
This home is located at 6923 W 100 S, Anderson, IN 46011 and is currently estimated at $385,825, approximately $132 per square foot. 6923 W 100 S is a home located in Madison County with nearby schools including Lapel Elementary School, Lapel Middle School, and Lapel Senior High School.
Ownership History
Date
Name
Owned For
Owner Type
Purchase Details
Closed on
Jul 21, 2009
Sold by
Hart Ronald E and Hart Michael J
Bought by
Manning Matthew A and Manning Elizabeth D
Current Estimated Value
Purchase Details
Closed on
Apr 24, 2009
Sold by
Hsbc Bank Usa Na
Bought by
Hart Ronald E and Hart Michael J
Purchase Details
Closed on
Mar 20, 2009
Sold by
Meyer Christopher B
Bought by
Hsbc Bank Usa Na
Create a Home Valuation Report for This Property
The Home Valuation Report is an in-depth analysis detailing your home's value as well as a comparison with similar homes in the area
Home Values in the Area
Average Home Value in this Area
Purchase History
| Date | Buyer | Sale Price | Title Company |
|---|---|---|---|
| Manning Matthew A | -- | -- | |
| Hart Ronald E | -- | -- | |
| Hsbc Bank Usa Na | $32,550 | -- |
Source: Public Records
Tax History Compared to Growth
Tax History
| Year | Tax Paid | Tax Assessment Tax Assessment Total Assessment is a certain percentage of the fair market value that is determined by local assessors to be the total taxable value of land and additions on the property. | Land | Improvement |
|---|---|---|---|---|
| 2024 | $3,314 | $325,000 | $30,800 | $294,200 |
| 2023 | $3,149 | $299,600 | $29,300 | $270,300 |
| 2022 | $2,960 | $288,400 | $27,900 | $260,500 |
| 2021 | $2,751 | $267,700 | $27,900 | $239,800 |
| 2020 | $2,640 | $256,700 | $26,500 | $230,200 |
| 2019 | $2,531 | $246,400 | $26,500 | $219,900 |
| 2018 | $2,379 | $221,900 | $26,500 | $195,400 |
| 2017 | $2,139 | $198,800 | $24,800 | $174,000 |
| 2016 | $2,153 | $200,500 | $24,800 | $175,700 |
| 2014 | $829 | $38,400 | $24,800 | $13,600 |
| 2013 | $829 | $38,000 | $24,800 | $13,200 |
Source: Public Records
Map
Nearby Homes
- 5668 W 250 S
- 0 W 300 S Unit MBR22051203
- 4896 W State Road 32
- 4669 W State Road 32
- 610 Tuscany Trail
- 0 Vine St
- 436 N 500 W
- Aspen II Plan at Tuscany
- Ironwood Plan at Tuscany
- Spruce Plan at Tuscany
- Ashton Plan at Tuscany
- Cooper Plan at Tuscany
- Bradford Plan at Tuscany
- Palmetto Plan at Tuscany
- Chestnut Plan at Tuscany
- Norway Plan at Tuscany
- Empress Plan at Tuscany
- Juniper Plan at Tuscany
- 1019 N John St
- 1309 Woodward St