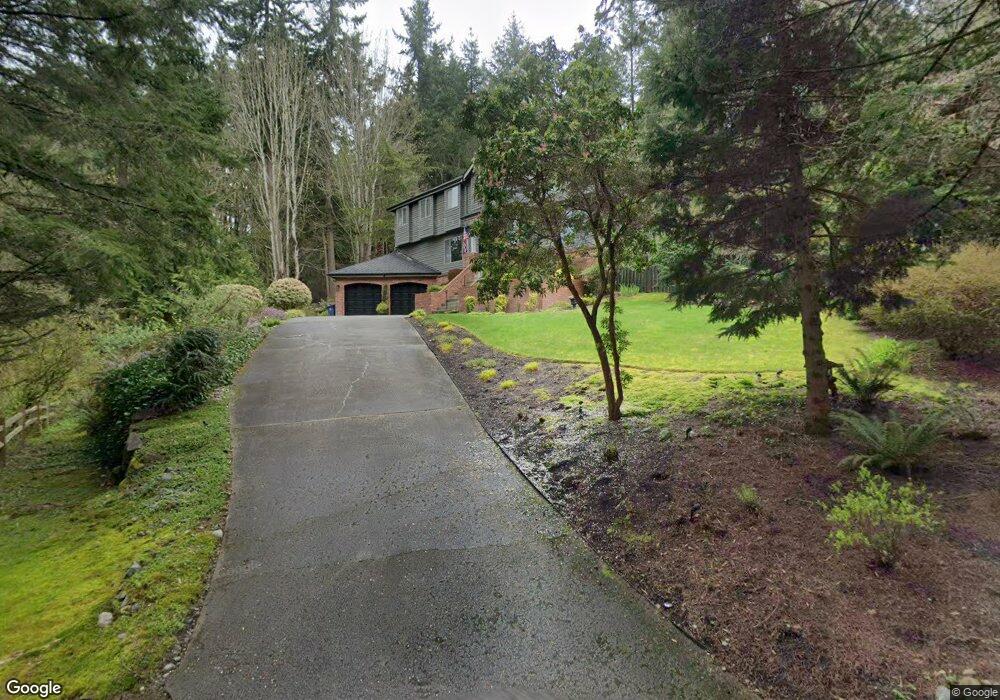
6925 163rd Place SW Edmonds, WA 98026
Estimated Value: $1,204,000 - $1,539,000
3
Beds
3
Baths
3,195
Sq Ft
$431/Sq Ft
Est. Value
About This Home
This home is located at 6925 163rd Place SW, Edmonds, WA 98026 and is currently estimated at $1,377,939, approximately $431 per square foot. 6925 163rd Place SW is a home located in Snohomish County with nearby schools including Meadowdale Elementary School, Meadowdale Middle School, and Meadowdale High School.
Ownership History
Date
Name
Owned For
Owner Type
Purchase Details
Closed on
May 23, 2002
Sold by
Westfall John J and Westfall Letitia M
Bought by
Tameishi Ken K and Tameishi Susan M
Current Estimated Value
Home Financials for this Owner
Home Financials are based on the most recent Mortgage that was taken out on this home.
Original Mortgage
$225,000
Outstanding Balance
$94,742
Interest Rate
6.89%
Estimated Equity
$1,283,197
Purchase Details
Closed on
Jun 17, 1999
Sold by
Woodward Gregg F and Woodward E
Bought by
Westfall John J and Westfall Letitia M
Home Financials for this Owner
Home Financials are based on the most recent Mortgage that was taken out on this home.
Original Mortgage
$296,800
Interest Rate
7.05%
Create a Home Valuation Report for This Property
The Home Valuation Report is an in-depth analysis detailing your home's value as well as a comparison with similar homes in the area
Home Values in the Area
Average Home Value in this Area
Purchase History
| Date | Buyer | Sale Price | Title Company |
|---|---|---|---|
| Tameishi Ken K | $395,000 | First American | |
| Westfall John J | $396,000 | Evergreen Title Company Inc |
Source: Public Records
Mortgage History
| Date | Status | Borrower | Loan Amount |
|---|---|---|---|
| Open | Tameishi Ken K | $225,000 | |
| Previous Owner | Westfall John J | $296,800 |
Source: Public Records
Tax History Compared to Growth
Tax History
| Year | Tax Paid | Tax Assessment Tax Assessment Total Assessment is a certain percentage of the fair market value that is determined by local assessors to be the total taxable value of land and additions on the property. | Land | Improvement |
|---|---|---|---|---|
| 2025 | $8,062 | $1,181,800 | $556,500 | $625,300 |
| 2024 | $8,062 | $1,142,700 | $540,800 | $601,900 |
| 2023 | $7,473 | $1,097,600 | $504,000 | $593,600 |
| 2022 | $7,466 | $901,800 | $398,000 | $503,800 |
| 2020 | $6,900 | $743,000 | $354,000 | $389,000 |
| 2019 | $6,709 | $728,100 | $343,000 | $385,100 |
| 2018 | $6,917 | $648,600 | $305,000 | $343,600 |
| 2017 | $5,952 | $584,500 | $261,000 | $323,500 |
| 2016 | $5,482 | $533,900 | $224,000 | $309,900 |
| 2015 | $5,459 | $500,600 | $211,000 | $289,600 |
| 2013 | $5,387 | $466,500 | $195,100 | $271,400 |
Source: Public Records
Map
Nearby Homes
- 16116 68th Ave W
- 6630 162nd Place SW
- 7217 Meadowdale Beach Rd
- 16530 76th Ave W
- 17008 72nd Place W
- 16410 60th Ave W
- 17110 66th Place W
- 5921 164th St SW
- 16706 60th Ave W
- Indigo Plan at Edmonds Ridge
- Lotus Plan at Edmonds Ridge
- Spirea Plan at Edmonds Ridge
- Verbena Plan at Edmonds Ridge
- Azalea Plan at Edmonds Ridge
- Ivy Plan at Edmonds Ridge
- 15424 61st Place W
- 5921 160th St SW
- 5724 161st St SW
- 6830 Meadowdale Beach Rd
- 5728 160th St SW
- 6923 163rd Place SW
- 6921 163rd Place SW
- 0 L51 N Meadowdale Rd
- 16217 N Meadowdale Rd
- 6919 163rd Place SW
- 16215 N Meadowdale Rd
- 16216 N Meadowdale Rd
- 16223 70th Place W
- 16225 70th Place W
- 16317 70th Place W
- 16219 70th Place W
- 6915 163rd Place SW
- 6912 161st Place SW
- 6922 163rd Place SW
- 6922 N Meadowdale Rd SW
- 16215 70th Place W
- 6805 162nd Place SW
- 16209 N Meadowdale Rd
- 16319 70th Place W
- 6908 161st Place SW