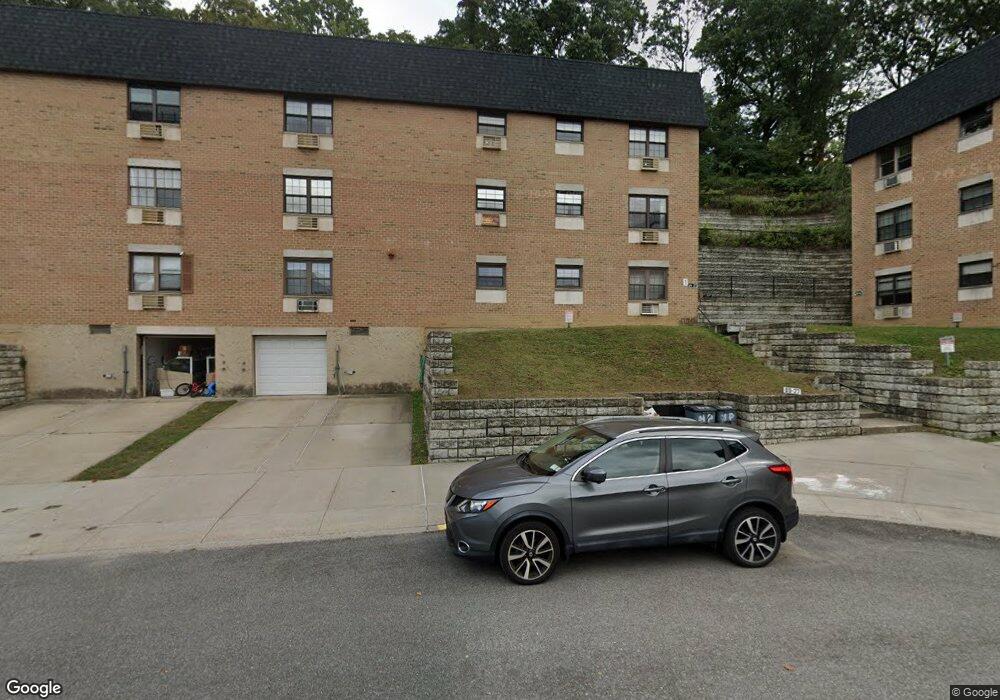
6927 242nd St Unit 56 Little Neck, NY 11362
Douglaston NeighborhoodEstimated Value: $558,000 - $656,000
--
Bed
--
Bath
1,059
Sq Ft
$571/Sq Ft
Est. Value
About This Home
This home is located at 6927 242nd St Unit 56, Little Neck, NY 11362 and is currently estimated at $605,190, approximately $571 per square foot. 6927 242nd St Unit 56 is a home located in Queens County with nearby schools including P.S. 221Q The North Hills School, Louis Pasteur Middle School 67, and Benjamin N Cardozo High School.
Ownership History
Date
Name
Owned For
Owner Type
Purchase Details
Closed on
Aug 8, 2025
Sold by
Jha Kim Chun and Chunjha Kim Chunjha
Bought by
Charles J You Trustee and Jae Hee You Trustee
Current Estimated Value
Purchase Details
Closed on
Aug 6, 2025
Sold by
Kim Chun Jha and Kim Chunjha
Bought by
Kim Chun Jha and Kim Chunjha
Purchase Details
Closed on
Sep 26, 2018
Sold by
Kim Chun Jha and You Jaehee
Bought by
Kim Chun Jha and You Hwee Yull
Purchase Details
Closed on
Oct 27, 2010
Sold by
You Hwee Yull and You Jaehee
Bought by
Kim Chun Jha and You Jaehee
Purchase Details
Closed on
Jun 16, 1995
Sold by
Seinfeld Rose and Seinfeld Elaine C
Bought by
Marquez Angelina
Home Financials for this Owner
Home Financials are based on the most recent Mortgage that was taken out on this home.
Original Mortgage
$137,750
Interest Rate
7.84%
Mortgage Type
Purchase Money Mortgage
Create a Home Valuation Report for This Property
The Home Valuation Report is an in-depth analysis detailing your home's value as well as a comparison with similar homes in the area
Home Values in the Area
Average Home Value in this Area
Purchase History
| Date | Buyer | Sale Price | Title Company |
|---|---|---|---|
| Charles J You Trustee | -- | -- | |
| Kim Chun Jha | -- | -- | |
| Kim Chun Jha | -- | -- | |
| Kim Chun Jha | -- | -- | |
| Kim Chun Jha | -- | -- | |
| Kim Chun Jha | -- | -- | |
| Marquez Angelina | $145,000 | First American Title Ins Co | |
| Marquez Angelina | $145,000 | First American Title Ins Co |
Source: Public Records
Mortgage History
| Date | Status | Borrower | Loan Amount |
|---|---|---|---|
| Previous Owner | Marquez Angelina | $137,750 |
Source: Public Records
Tax History Compared to Growth
Tax History
| Year | Tax Paid | Tax Assessment Tax Assessment Total Assessment is a certain percentage of the fair market value that is determined by local assessors to be the total taxable value of land and additions on the property. | Land | Improvement |
|---|---|---|---|---|
| 2025 | $1,684 | $24,551 | $2,171 | $22,380 |
| 2024 | $1,788 | $24,365 | $2,188 | $22,177 |
| 2023 | $1,675 | $22,986 | $2,272 | $20,714 |
| 2022 | $1,505 | $33,208 | $3,738 | $29,470 |
| 2021 | $1,494 | $33,208 | $3,738 | $29,470 |
| 2020 | $1,506 | $33,907 | $3,738 | $30,169 |
| 2019 | $1,465 | $31,837 | $3,738 | $28,099 |
| 2018 | $3,607 | $19,155 | $2,360 | $16,795 |
| 2017 | $3,384 | $18,071 | $2,274 | $15,797 |
| 2016 | $3,098 | $18,071 | $2,274 | $15,797 |
| 2015 | $1,836 | $17,049 | $2,787 | $14,262 |
| 2014 | $1,836 | $16,920 | $2,520 | $14,400 |
Source: Public Records
Map
Nearby Homes
- 68-09 242nd St Unit 33A
- 68-05 242nd St Unit 31A
- 240-02 70th Ave Unit 1C
- 240-29 68th Ave Unit 14
- 240-21 68th Ave Unit 10
- 7157 Douglaston Pkwy
- 65-19 242nd St Unit 8D
- 240-02 65th Ave
- 239-19 66th Ave
- 243-17 72nd Ave
- 242-25 Oak Park Dr
- 6239 Douglaston Pkwy Unit 19
- 24321 73rd Ave
- 2-42 Oak Park Dr
- 2-42 Oak Park Dr Unit 99A
- 6227 Douglaston Pkwy Unit 13
- 24188 Oak Park Dr Unit 188
- 241-43B Oak Park Dr
- 241-43B Oak Park Dr Unit TH
- 73-30 244th St
- 6927 242nd St Unit 57
- 6927 242nd St Unit 55
- 69-27 242nd St
- 6927 242nd St
- 6925 242nd St Unit 60
- 6925 242nd St Unit 59
- 6925 242nd St Unit 58
- 69-25 242nd St Unit 1st Fl
- 69-25 242nd St Unit 1st
- 69-25 242nd St
- 69-25 242nd St Unit 20A
- 24040 70th Ave Unit 2
- 24040 70th Ave Unit 17C
- 24040 70th Ave Unit 17B
- 24040 70th Ave Unit 17A
- 24040 70th Ave Unit 17B
- 24040 70th Ave Unit 2
- 24040 70th Ave Unit 2
- 6918 242nd St Unit 1Fl
- 6918 242nd St Unit 22