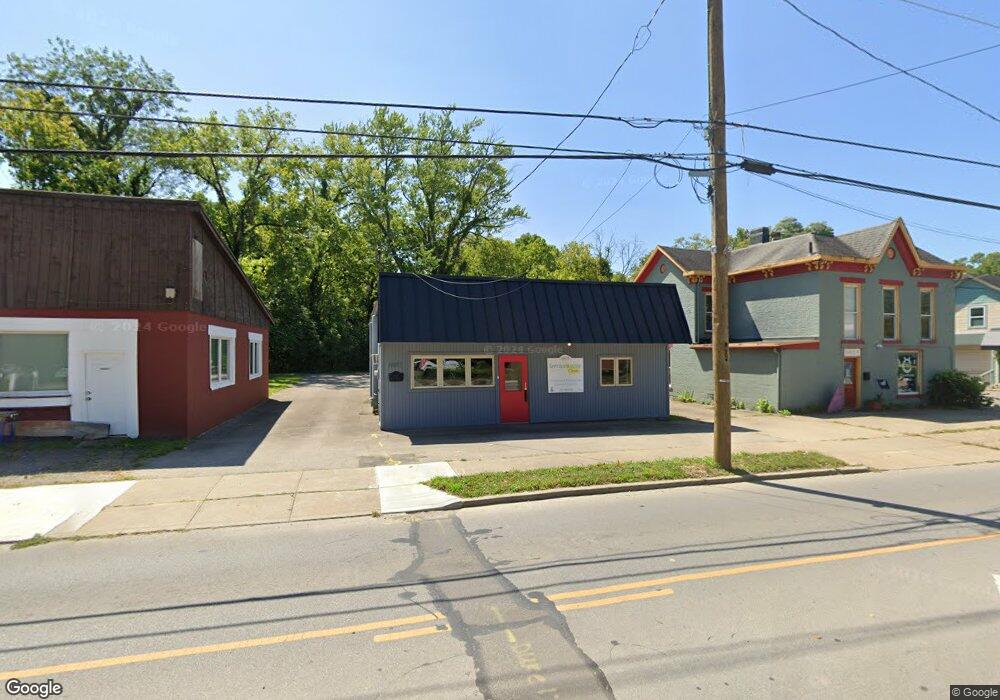
6927 Main St Cincinnati, OH 45244
Estimated Value: $241,511
Studio
--
Bath
1,581
Sq Ft
$153/Sq Ft
Est. Value
About This Home
This home is located at 6927 Main St, Cincinnati, OH 45244 and is currently estimated at $241,511, approximately $152 per square foot. 6927 Main St is a home located in Hamilton County with nearby schools including Mercer Elementary School, Nagel Middle School, and Turpin High School.
Ownership History
Date
Name
Owned For
Owner Type
Purchase Details
Closed on
Mar 20, 2023
Sold by
Trk Investment Solutions Llc
Bought by
Trk Investment Solutions Llc
Current Estimated Value
Purchase Details
Closed on
Jan 6, 2021
Sold by
Gogo Investments Llc
Bought by
Trk Investment Solutions Llc
Home Financials for this Owner
Home Financials are based on the most recent Mortgage that was taken out on this home.
Original Mortgage
$135,200
Interest Rate
2.71%
Mortgage Type
Commercial
Purchase Details
Closed on
Oct 18, 2013
Sold by
Bass Richard Allen and Bass Linda Lee
Bought by
Gogo Investments Llc
Purchase Details
Closed on
Dec 5, 1996
Sold by
Hueber Richard
Bought by
Bass Richard Allen and Bass Linda Lee
Purchase Details
Closed on
May 15, 1995
Sold by
Branhan Jeffrey
Bought by
Branhan Jason A
Create a Home Valuation Report for This Property
The Home Valuation Report is an in-depth analysis detailing your home's value as well as a comparison with similar homes in the area
Home Values in the Area
Average Home Value in this Area
Purchase History
| Date | Buyer | Sale Price | Title Company |
|---|---|---|---|
| Trk Investment Solutions Llc | $250 | None Listed On Document | |
| Trk Investment Solutions Llc | $169,000 | None Available | |
| Gogo Investments Llc | $145,000 | Attorney | |
| Bass Richard Allen | $101,000 | Techne Title Agency Inc | |
| Hueber Richard | -- | -- | |
| Thomson Douglas W | -- | -- | |
| Branhan Jason A | -- | -- |
Source: Public Records
Mortgage History
| Date | Status | Borrower | Loan Amount |
|---|---|---|---|
| Previous Owner | Trk Investment Solutions Llc | $135,200 |
Source: Public Records
Tax History
| Year | Tax Paid | Tax Assessment Tax Assessment Total Assessment is a certain percentage of the fair market value that is determined by local assessors to be the total taxable value of land and additions on the property. | Land | Improvement |
|---|---|---|---|---|
| 2025 | $5,311 | $60,046 | $24,297 | $35,749 |
| 2024 | $5,308 | $60,046 | $24,297 | $35,749 |
| 2023 | $5,183 | $59,150 | $23,401 | $35,749 |
| 2022 | $3,948 | $44,478 | $20,811 | $23,667 |
| 2021 | $3,927 | $44,478 | $20,811 | $23,667 |
| 2020 | $3,900 | $44,478 | $20,811 | $23,667 |
| 2019 | $3,871 | $41,570 | $19,450 | $22,120 |
| 2018 | $3,684 | $41,570 | $19,450 | $22,120 |
| 2017 | $3,574 | $41,570 | $19,450 | $22,120 |
| 2016 | $4,368 | $50,750 | $20,545 | $30,205 |
| 2015 | $4,536 | $50,750 | $20,545 | $30,205 |
| 2014 | $4,492 | $50,750 | $20,545 | $30,205 |
| 2013 | $2,789 | $33,506 | $20,545 | $12,961 |
Source: Public Records
Map
Nearby Homes
- 6809 Jefferson St
- 6912 Edith St
- 3305 Scioto Dr
- 6716 Treeridge Dr
- 2911 Perthwood Dr
- 6362 Stirrup Rd
- 3746 Miami Run
- 3763 Miami Run
- 3767 Miami Run
- 3750 Miami Run
- 3758 Miami Run
- 3771 Miami Run
- 3766 Miami Run
- 3754 Miami Run
- 3762 Miami Run
- 2669 Newtown Rd
- 7410 Orchard St
- 7412 Orchard St
- 7408 Orchard St
- 7406 Orchard St
Your Personal Tour Guide
Ask me questions while you tour the home.