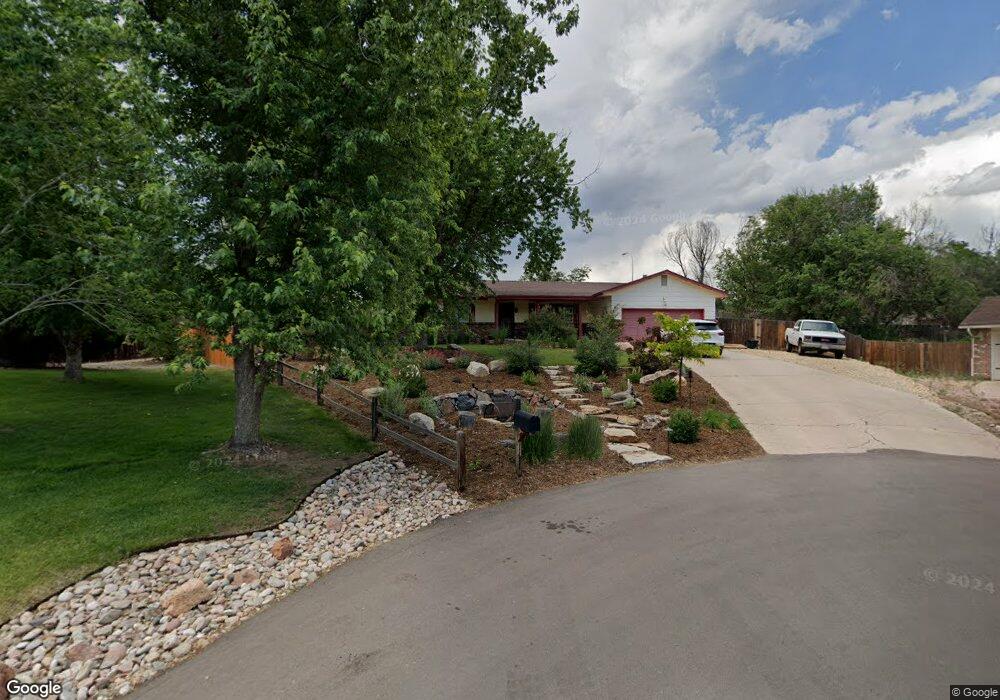
6928 Boysenberry Way Colorado Springs, CO 80918
Falcon Estates NeighborhoodEstimated Value: $479,000 - $595,000
4
Beds
3
Baths
1,588
Sq Ft
$335/Sq Ft
Est. Value
About This Home
This home is located at 6928 Boysenberry Way, Colorado Springs, CO 80918 and is currently estimated at $532,728, approximately $335 per square foot. 6928 Boysenberry Way is a home located in El Paso County with nearby schools including Pioneer Elementary School, Mountain Ridge Middle School, and Rampart High School.
Ownership History
Date
Name
Owned For
Owner Type
Purchase Details
Closed on
Jan 23, 2020
Sold by
Hinkle Charles David and Hinkle Kennye Lyn
Bought by
Hinkle Family Trust
Current Estimated Value
Purchase Details
Closed on
Apr 14, 2014
Sold by
Sellier Nathan
Bought by
Hinkle Kennye Lyn and Hinkle Charles David
Purchase Details
Closed on
Jul 19, 2013
Sold by
Hinkle Kennye Lyn
Bought by
Hinkle Kennye Lyn and Hinkle Charles David
Purchase Details
Closed on
Apr 25, 2013
Sold by
Mcnalley Della R
Bought by
Sellier Nathan
Purchase Details
Closed on
Sep 14, 2006
Sold by
Mcnalley Della R
Bought by
Mcnalley Della R and Hinkle Kennye L
Purchase Details
Closed on
Dec 17, 1982
Bought by
Hinkle Kennye Lyn
Purchase Details
Closed on
May 28, 1975
Bought by
Hinkle Kennye Lyn
Purchase Details
Closed on
Apr 2, 1974
Bought by
Hinkle Kennye Lyn
Purchase Details
Closed on
Sep 17, 1971
Bought by
Hinkle Kennye Lyn
Purchase Details
Closed on
Apr 1, 1969
Bought by
Hinkle Kennye Lyn
Purchase Details
Closed on
Dec 19, 1968
Bought by
Hinkle Charles David
Create a Home Valuation Report for This Property
The Home Valuation Report is an in-depth analysis detailing your home's value as well as a comparison with similar homes in the area
Home Values in the Area
Average Home Value in this Area
Purchase History
| Date | Buyer | Sale Price | Title Company |
|---|---|---|---|
| Hinkle Family Trust | -- | None Available | |
| Hinkle Kennye Lyn | -- | None Available | |
| Hinkle Kennye Lyn | -- | None Available | |
| Sellier Nathan | -- | None Available | |
| Mcnalley Della R | -- | None Available | |
| Hinkle Kennye Lyn | -- | -- | |
| Hinkle Kennye Lyn | -- | -- | |
| Hinkle Kennye Lyn | -- | -- | |
| Hinkle Kennye Lyn | -- | -- | |
| Hinkle Kennye Lyn | -- | -- | |
| Hinkle Charles David | -- | -- |
Source: Public Records
Tax History Compared to Growth
Tax History
| Year | Tax Paid | Tax Assessment Tax Assessment Total Assessment is a certain percentage of the fair market value that is determined by local assessors to be the total taxable value of land and additions on the property. | Land | Improvement |
|---|---|---|---|---|
| 2025 | $2,201 | $38,880 | -- | -- |
| 2024 | $2,172 | $40,530 | $7,090 | $33,440 |
| 2022 | $1,794 | $27,110 | $5,880 | $21,230 |
| 2021 | $1,993 | $27,890 | $6,050 | $21,840 |
| 2020 | $1,800 | $23,380 | $5,260 | $18,120 |
| 2019 | $1,781 | $23,380 | $5,260 | $18,120 |
| 2018 | $1,540 | $19,870 | $4,610 | $15,260 |
| 2017 | $1,534 | $19,870 | $4,610 | $15,260 |
| 2016 | $1,476 | $19,090 | $5,090 | $14,000 |
| 2015 | $1,473 | $19,090 | $5,090 | $14,000 |
| 2014 | $1,379 | $17,850 | $4,780 | $13,070 |
Source: Public Records
Map
Nearby Homes
- 6881 Los Reyes Cir
- 6872 Los Reyes Cir
- 6868 Los Reyes Cir
- 6806 Los Reyes Cir
- 2661 Hatch Cir
- 2546 Hatch Cir
- 2579 Hatch Cir
- 2570 Hatch Cir
- 2575 Hatch Cir
- 2563 Integrity Ct
- 2570 Covington Place
- 6641 Gambol Quail Dr W
- 6655 Sproul Ln
- 2650 Canton Ln
- 2635 Canton Ln
- 7191 Ross Dr
- 1871 Brookwood Dr
- 2113 Roundtop Ct
- 6447 Jonathan Ct Unit E1
- 6423 McNichols Ct
- 6927 Boysenberry Way
- 6924 Boysenberry Way
- 6920 Cherrywood Dr
- 6920 Boysenberry Way
- 6916 Cherrywood Dr
- 6923 Boysenberry Way
- 6915 Boysenberry Way
- 6912 Cherrywood Dr
- 6916 Boysenberry Way
- 2220 Brookwood Dr
- 7043 Stinson Dr
- 6919 Cherrywood Dr
- 6912 Boysenberry Way
- 2230 Brookwood Dr
- 6915 Cherrywood Dr
- 2168 Wildwood Dr
- 6908 Cherrywood Dr
- 2171 Wildwood Dr
- 2210 Brookwood Dr
- 6911 Cherrywood Dr