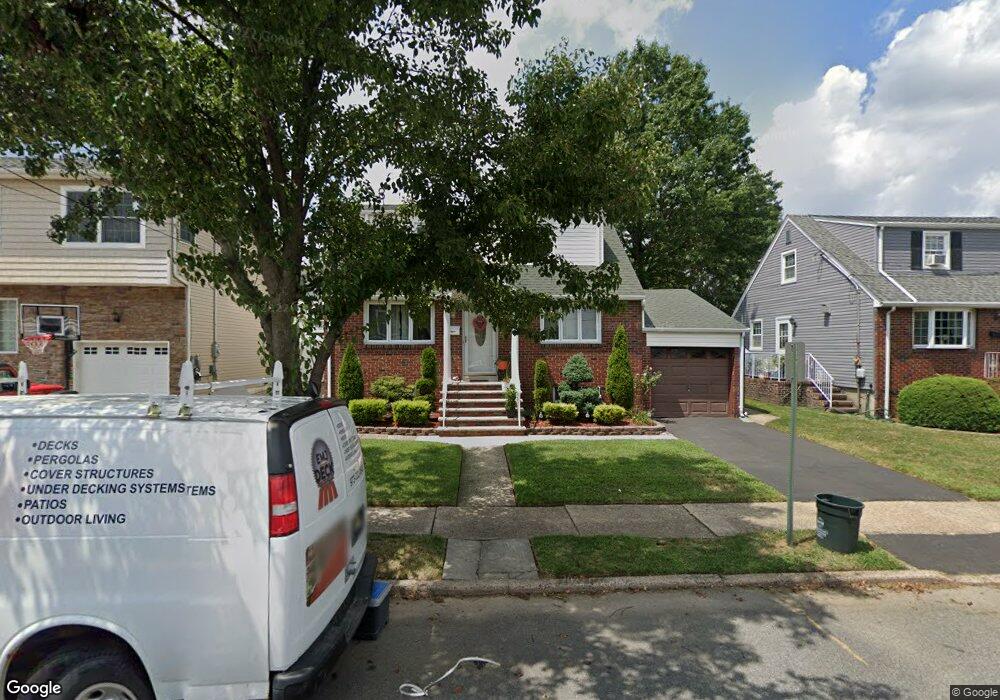
693 3rd St Secaucus, NJ 07094
Estimated Value: $603,289 - $784,000
Studio
--
Bath
1,198
Sq Ft
$569/Sq Ft
Est. Value
About This Home
This home is located at 693 3rd St, Secaucus, NJ 07094 and is currently estimated at $681,072, approximately $568 per square foot. 693 3rd St is a home located in Hudson County with nearby schools including Secaucus High School.
Ownership History
Date
Name
Owned For
Owner Type
Purchase Details
Closed on
Jan 3, 2003
Sold by
Cogelia Maria
Bought by
Eltair Salim and Shuhayyib Randa
Current Estimated Value
Home Financials for this Owner
Home Financials are based on the most recent Mortgage that was taken out on this home.
Original Mortgage
$266,000
Interest Rate
5.64%
Mortgage Type
Stand Alone First
Purchase Details
Closed on
Oct 31, 1995
Sold by
Naszimento Bruce
Bought by
Cogelia Maria and Naszimento Maria
Create a Home Valuation Report for This Property
The Home Valuation Report is an in-depth analysis detailing your home's value as well as a comparison with similar homes in the area
Home Values in the Area
Average Home Value in this Area
Purchase History
| Date | Buyer | Sale Price | Title Company |
|---|---|---|---|
| Eltair Salim | $332,500 | Chicago Title Insurance Co | |
| Cogelia Maria | -- | -- |
Source: Public Records
Mortgage History
| Date | Status | Borrower | Loan Amount |
|---|---|---|---|
| Previous Owner | Eltair Salim | $266,000 |
Source: Public Records
Tax History
| Year | Tax Paid | Tax Assessment Tax Assessment Total Assessment is a certain percentage of the fair market value that is determined by local assessors to be the total taxable value of land and additions on the property. | Land | Improvement |
|---|---|---|---|---|
| 2025 | $6,294 | $153,800 | $92,300 | $61,500 |
| 2024 | $6,104 | $153,800 | $92,300 | $61,500 |
| 2023 | $6,104 | $153,800 | $92,300 | $61,500 |
| 2022 | $5,787 | $153,800 | $92,300 | $61,500 |
| 2021 | $5,798 | $153,800 | $92,300 | $61,500 |
| 2020 | $5,746 | $153,800 | $92,300 | $61,500 |
| 2019 | $5,709 | $153,800 | $92,300 | $61,500 |
| 2018 | $5,552 | $153,800 | $92,300 | $61,500 |
| 2017 | $5,558 | $153,800 | $92,300 | $61,500 |
| 2016 | $5,701 | $153,800 | $92,300 | $61,500 |
| 2015 | $5,694 | $153,800 | $92,300 | $61,500 |
| 2014 | $5,792 | $153,800 | $92,300 | $61,500 |
Source: Public Records
Map
Nearby Homes
- 6 Walter Place
- 718 1st St
- 229 Centre Ave
- 761 4th St Unit B
- 761 4th St
- 761 4th St Unit A
- 720 Hudson Ave
- 781 2nd St
- 672 Chestnut Place
- 10 Raydol Ave
- 329 Centre Ave
- 728 Irving Place
- 774 8th St
- 842 7th St
- 827 Hudson Ave
- 24 Marina Key Unit 24
- 840 Roosevelt Ave
- 16 Marina Key Unit 16
- 2 Radio Ave Unit C12
- 40 Valley Ct
Your Personal Tour Guide
Ask me questions while you tour the home.