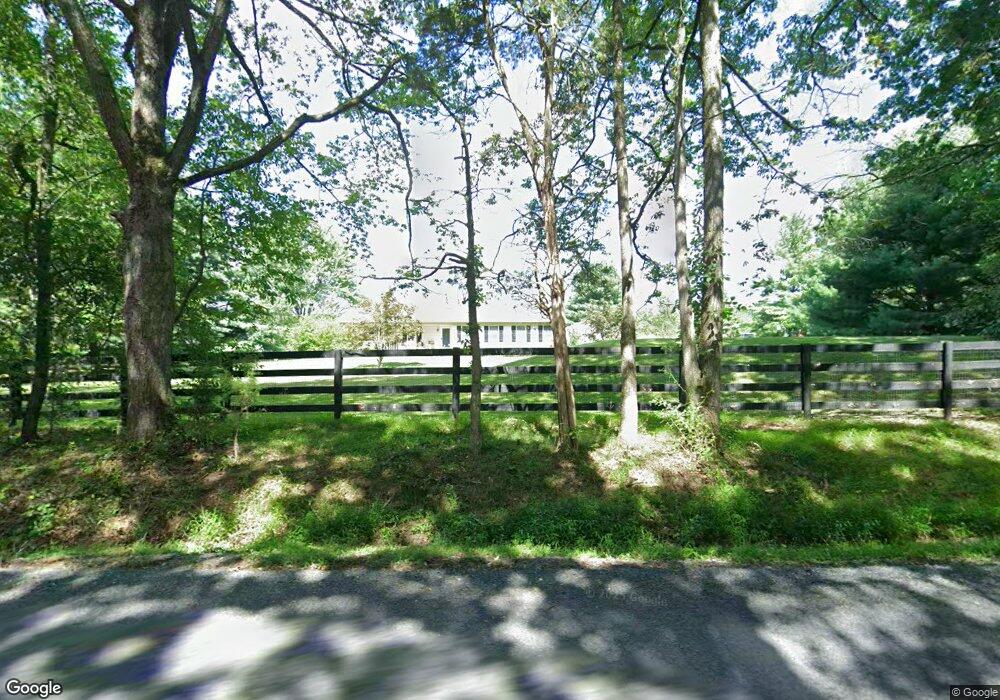
693 Bucks Rd Perkasie, PA 18944
Estimated Value: $629,303 - $1,056,000
4
Beds
2
Baths
1,922
Sq Ft
$403/Sq Ft
Est. Value
About This Home
This home is located at 693 Bucks Rd, Perkasie, PA 18944 and is currently estimated at $774,826, approximately $403 per square foot. 693 Bucks Rd is a home located in Bucks County with nearby schools including Pennridge High School.
Ownership History
Date
Name
Owned For
Owner Type
Purchase Details
Closed on
May 15, 2020
Sold by
Griffin Patricia C and Jones Teri L
Bought by
Jones Patricia C and Jones Teri L
Current Estimated Value
Home Financials for this Owner
Home Financials are based on the most recent Mortgage that was taken out on this home.
Original Mortgage
$343,000
Outstanding Balance
$303,946
Interest Rate
3.3%
Mortgage Type
New Conventional
Estimated Equity
$470,880
Purchase Details
Closed on
Jul 8, 2009
Sold by
Macneel Thomas W and Mac Neel Dorothy L
Bought by
Griffin Patricia C and Jones Teri L
Home Financials for this Owner
Home Financials are based on the most recent Mortgage that was taken out on this home.
Original Mortgage
$409,447
Interest Rate
5.19%
Mortgage Type
FHA
Purchase Details
Closed on
May 10, 1993
Bought by
Macneel Thomas W and Macneel Dorothy L
Create a Home Valuation Report for This Property
The Home Valuation Report is an in-depth analysis detailing your home's value as well as a comparison with similar homes in the area
Home Values in the Area
Average Home Value in this Area
Purchase History
| Date | Buyer | Sale Price | Title Company |
|---|---|---|---|
| Jones Patricia C | -- | Camelot Abstract Inc | |
| Griffin Patricia C | $417,000 | None Available | |
| Macneel Thomas W | -- | -- |
Source: Public Records
Mortgage History
| Date | Status | Borrower | Loan Amount |
|---|---|---|---|
| Open | Jones Patricia C | $343,000 | |
| Closed | Griffin Patricia C | $409,447 |
Source: Public Records
Tax History Compared to Growth
Tax History
| Year | Tax Paid | Tax Assessment Tax Assessment Total Assessment is a certain percentage of the fair market value that is determined by local assessors to be the total taxable value of land and additions on the property. | Land | Improvement |
|---|---|---|---|---|
| 2025 | $6,665 | $39,160 | $7,440 | $31,720 |
| 2024 | $6,665 | $39,160 | $7,440 | $31,720 |
| 2023 | $6,587 | $39,160 | $7,440 | $31,720 |
| 2022 | $6,587 | $39,160 | $7,440 | $31,720 |
| 2021 | $6,587 | $39,160 | $7,440 | $31,720 |
| 2020 | $6,587 | $39,160 | $7,440 | $31,720 |
| 2019 | $6,548 | $39,160 | $7,440 | $31,720 |
| 2018 | $6,548 | $39,160 | $7,440 | $31,720 |
| 2017 | $6,499 | $39,160 | $7,440 | $31,720 |
| 2016 | $6,499 | $39,160 | $7,440 | $31,720 |
| 2015 | -- | $39,160 | $7,440 | $31,720 |
| 2014 | -- | $39,160 | $7,440 | $31,720 |
Source: Public Records
Map
Nearby Homes
- 3267 Bushwood Dr
- 291 Elephant Rd
- 445 Elephant Rd
- 169 Marlyn Ln
- 178 Elephant Rd Unit C26
- 178 Elephant Rd Unit A6
- 1412 Route 113
- 238 Allem Ln Unit 238
- 17 Ruhl Dr
- 135 Bishop Way
- 316 Schadle Rd
- Lot 10 Schadle Rd
- 116 Bishop Way
- 132 Applewood Ln
- 319 Pennington Way
- 2004 Evergreen Dr
- 137 S Main St
- 161 Maple Ave
- 81 Williams Dr
- 204 Pennland Farm Dr
- 691 Bucks Rd
- 705 Bucks Rd
- 715 Bucks Rd
- 737 Bucks Rd
- 643 Bucks Rd
- 644 Bucks Rd
- 1469 Blue School Rd
- 717 Bucks Rd
- 2152 Bedminster Rd
- 764 Bucks Rd
- 620 Bucks Rd
- 621 Bucks Rd
- 1193 Blue School Rd
- 2154 Bedminster Rd
- 1483 Blue School Rd
- 616 Bucks Rd
- 610 Bucks Rd
- 2130 Bedminster Rd
- 2090 Bedminster Rd
- 1153 Blue School Rd