Estimated Value: $467,000 - $535,000
Studio
--
Bath
1,831
Sq Ft
$280/Sq Ft
Est. Value
About This Home
This home is located at 693 Lighthouse Point Rd, Eucha, OK 74342 and is currently estimated at $513,170, approximately $280 per square foot. 693 Lighthouse Point Rd is a home with nearby schools including Jay Elementary School, Jay Upper Elementary School, and Jay Middle School.
Ownership History
Date
Name
Owned For
Owner Type
Purchase Details
Closed on
Jul 31, 2013
Sold by
Williams Blair L
Bought by
Williams Robert A and Williams Blair L
Current Estimated Value
Purchase Details
Closed on
Feb 1, 2008
Sold by
Stanford Harold R and Stanford Cheryl F
Bought by
Stanford Cheryl F and Cheryl F Stanford Revocable Trust
Purchase Details
Closed on
Sep 2, 2007
Sold by
Yale Equipment And Services Inc
Bought by
Stanford Harold R and Stanford Cheryl F
Home Financials for this Owner
Home Financials are based on the most recent Mortgage that was taken out on this home.
Original Mortgage
$70,000
Interest Rate
6.66%
Mortgage Type
Future Advance Clause Open End Mortgage
Purchase Details
Closed on
Jan 12, 1999
Sold by
Lewis Scott C and Lewis Mary B
Purchase Details
Closed on
Jan 5, 1998
Sold by
Lewis Scott C and Lewis Mary B
Purchase Details
Closed on
Dec 3, 1997
Sold by
Lewis Scott C and Lewis Mary B
Create a Home Valuation Report for This Property
The Home Valuation Report is an in-depth analysis detailing your home's value as well as a comparison with similar homes in the area
Purchase History
| Date | Buyer | Sale Price | Title Company |
|---|---|---|---|
| Williams Robert A | -- | None Available | |
| Williams Robert A | -- | None Available | |
| Stanford Cheryl F | -- | -- | |
| Stanford Harold R | $90,000 | -- | |
| -- | -- | -- | |
| -- | -- | -- | |
| -- | -- | -- | |
| -- | -- | -- | |
| -- | -- | -- | |
| -- | -- | -- | |
| -- | -- | -- | |
| -- | -- | -- | |
| -- | -- | -- |
Source: Public Records
Mortgage History
| Date | Status | Borrower | Loan Amount |
|---|---|---|---|
| Previous Owner | Stanford Harold R | $70,000 |
Source: Public Records
Tax History
| Year | Tax Paid | Tax Assessment Tax Assessment Total Assessment is a certain percentage of the fair market value that is determined by local assessors to be the total taxable value of land and additions on the property. | Land | Improvement |
|---|---|---|---|---|
| 2025 | $2,444 | $27,413 | $7,312 | $20,101 |
| 2024 | $2,328 | $26,107 | $6,964 | $19,143 |
| 2023 | $2,328 | $24,865 | $6,762 | $18,103 |
| 2022 | $2,121 | $24,865 | $6,775 | $18,090 |
| 2021 | $1,780 | $23,681 | $6,602 | $17,079 |
| 2020 | $1,748 | $22,553 | $6,413 | $16,140 |
| 2019 | $1,671 | $20,456 | $5,689 | $14,767 |
| 2018 | $1,608 | $20,456 | $5,710 | $14,746 |
| 2017 | $1,517 | $19,155 | $5,201 | $13,954 |
| 2016 | $1,430 | $18,243 | $4,919 | $13,324 |
| 2015 | $1,610 | $16,547 | $4,149 | $12,398 |
| 2014 | $1,574 | $15,759 | $3,791 | $11,968 |
Source: Public Records
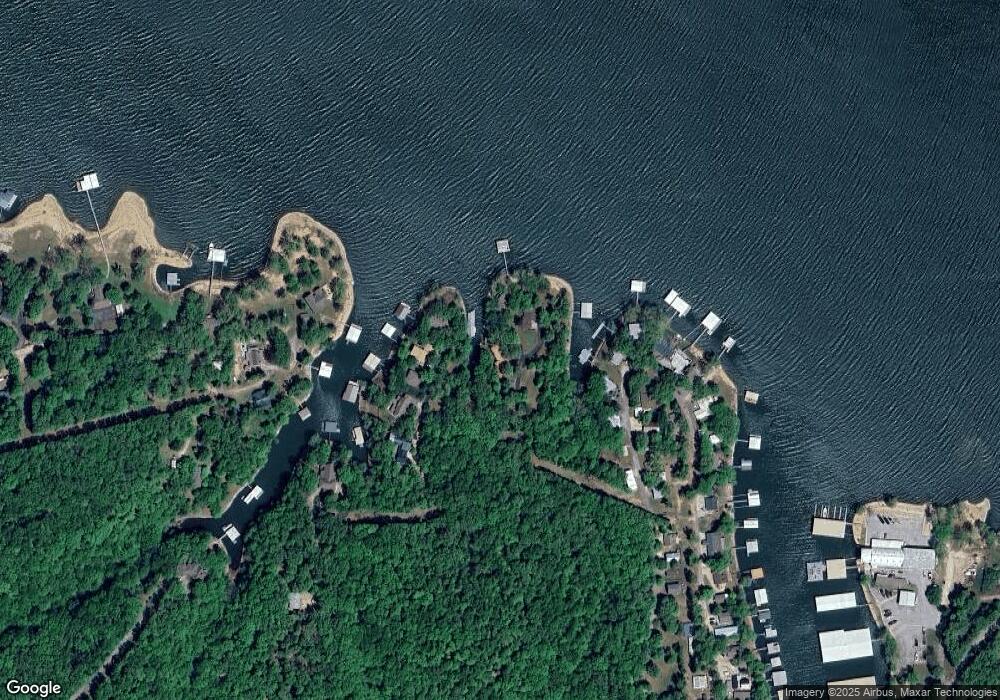
Map
Nearby Homes
- 295 Private Road 101
- 5486 County Road 366
- 428 Hendryx Point Rd
- (Parcel 1) E 355 Rd
- (Parcel 3) E 355 Rd
- (Lot K) E 355 Rd
- (Parcel 2) E 355 Rd
- (Lot J) E 355 Rd
- (Lot I) E 355 Rd
- Tract C E 355 Rd
- Tract F E 355 Rd
- TBD Ridge
- 36063 S 545 Rd
- 150 Oaks Rd
- 0 David Hall Blvd Unit 26685240
- 0 David Hall Blvd Unit 26702164
- 0 David Hall Blvd Unit 26685128
- 0 David Hall Blvd Unit 26645861
- 0 David Hall Blvd Unit 26712156
- 0 David Hall Blvd Unit 26564690
- 677 Lighthouse Point Rd
- 692 Lighthouse Pt Rd
- 591 Lighthouse Point Rd
- 273 Private Road 101
- 2099 Hendryx Point Rd
- 2120 Hendryx Point Rd
- 2150 Hendryx Point Rd
- 591 Lighthouse Point Rd
- 2170 Hendryx Point Rd
- 217 Private Road 101
- 2190 Hendryx Point Rd
- 209 Private Road 101
- 2210 Hendryx Point Rd
- 220 Hendryx Point Rd
- 2247 Hendryx Point Rd
- 155 Private Road 123
- 2238 Hendryx Point Rd
- 155 Private Rd Unit 123
- 2270 Hendryx Point Rd
- 155 Private Rd 123 Dr
Your Personal Tour Guide
Ask me questions while you tour the home.