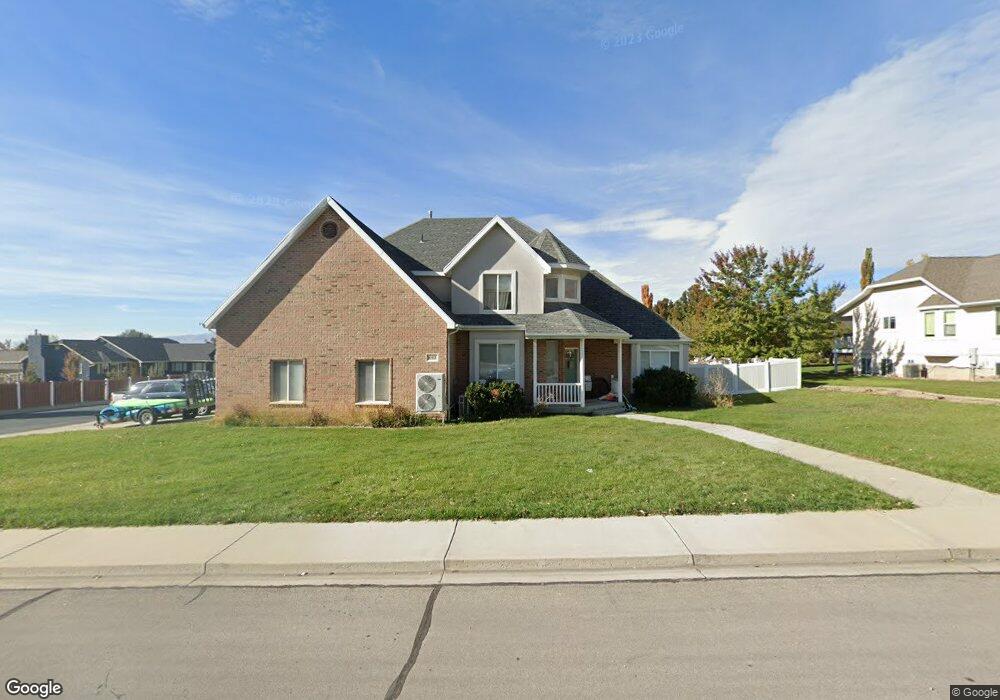
693 N 400 E Lindon, UT 84042
Estimated Value: $819,000 - $1,004,000
4
Beds
3
Baths
4,333
Sq Ft
$214/Sq Ft
Est. Value
About This Home
This home is located at 693 N 400 E, Lindon, UT 84042 and is currently estimated at $927,393, approximately $214 per square foot. 693 N 400 E is a home located in Utah County with nearby schools including Lindon Elementary School, Oak Canyon Junior High School, and Pleasant Grove High School.
Ownership History
Date
Name
Owned For
Owner Type
Purchase Details
Closed on
Oct 31, 2019
Sold by
Geyerman James T and Geyerman Amy L
Bought by
Naoupu Armond
Current Estimated Value
Home Financials for this Owner
Home Financials are based on the most recent Mortgage that was taken out on this home.
Original Mortgage
$438,761
Outstanding Balance
$386,762
Interest Rate
3.7%
Mortgage Type
New Conventional
Estimated Equity
$540,631
Purchase Details
Closed on
May 29, 2002
Sold by
Lad Enterprises Lc
Bought by
Geyerman James T and Geyerman Amy L
Create a Home Valuation Report for This Property
The Home Valuation Report is an in-depth analysis detailing your home's value as well as a comparison with similar homes in the area
Home Values in the Area
Average Home Value in this Area
Purchase History
| Date | Buyer | Sale Price | Title Company |
|---|---|---|---|
| Naoupu Armond | -- | Old Republic Title | |
| Geyerman James T | -- | Security Title & Abstract |
Source: Public Records
Mortgage History
| Date | Status | Borrower | Loan Amount |
|---|---|---|---|
| Open | Naoupu Armond | $438,761 |
Source: Public Records
Tax History
| Year | Tax Paid | Tax Assessment Tax Assessment Total Assessment is a certain percentage of the fair market value that is determined by local assessors to be the total taxable value of land and additions on the property. | Land | Improvement |
|---|---|---|---|---|
| 2025 | $3,348 | $423,170 | -- | -- |
| 2024 | $3,348 | $412,720 | $0 | $0 |
| 2023 | $3,185 | $421,685 | $0 | $0 |
| 2022 | $3,110 | $397,815 | $0 | $0 |
| 2021 | $2,992 | $577,100 | $239,500 | $337,600 |
| 2020 | $2,856 | $542,300 | $217,700 | $324,600 |
| 2019 | $2,651 | $525,200 | $200,600 | $324,600 |
| 2018 | $2,538 | $474,000 | $183,500 | $290,500 |
| 2017 | $2,581 | $258,390 | $0 | $0 |
| 2016 | $2,745 | $254,210 | $0 | $0 |
| 2015 | $2,665 | $233,365 | $0 | $0 |
| 2014 | $2,576 | $223,410 | $0 | $0 |
Source: Public Records
Map
Nearby Homes
- 314 E 750 N
- 308 E 750 N
- 650 S 1600 E
- 1541 E Blackhawk Dr
- 271 N 400 E Unit 1
- 1172 E Murdock Dr
- 790 E 400 N
- 1677 E 480 S
- 133 Canal Dr
- 701 E 215 N
- 517 N 80 W
- 1176 E 470 S
- 325 S 1300 E
- 229 E 60 N
- 433 N Locust Ave
- 190 E 800 N Unit 4
- 150 E 800 N Unit 2
- 170 E 800 N Unit 3
- 130 E 800 N Unit 1
- 240 E Center St
Your Personal Tour Guide
Ask me questions while you tour the home.