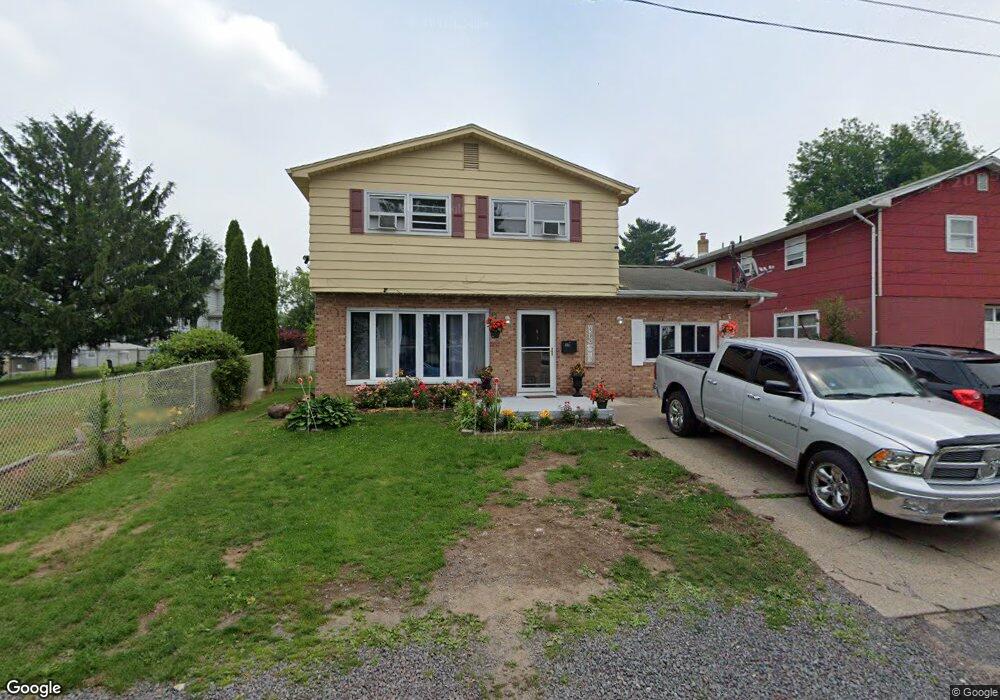
693 State Ct Hazleton, PA 18201
Estimated Value: $171,855 - $224,000
Studio
--
Bath
1,780
Sq Ft
$112/Sq Ft
Est. Value
About This Home
This home is located at 693 State Ct, Hazleton, PA 18201 and is currently estimated at $198,964, approximately $111 per square foot. 693 State Ct is a home located in Luzerne County with nearby schools including Hazleton Area High School, Immanuel Christian School, and Bishop Hafey Junior/Senior High School.
Ownership History
Date
Name
Owned For
Owner Type
Purchase Details
Closed on
Apr 22, 2024
Sold by
Ramirez Ventura Edibulga
Bought by
Ramirez Ventura Edibulga and Medina Ramirez Edili
Current Estimated Value
Purchase Details
Closed on
Nov 1, 2020
Sold by
Simet Regino
Bought by
Ventura Edibulga Ramirez
Home Financials for this Owner
Home Financials are based on the most recent Mortgage that was taken out on this home.
Original Mortgage
$162,011
Interest Rate
2.8%
Mortgage Type
FHA
Purchase Details
Closed on
May 18, 2012
Sold by
Hsbc Bank Usa Na
Bought by
Simet Regino
Purchase Details
Closed on
Sep 2, 2010
Sold by
Gianduso Gary J and Gianduso Najwa
Bought by
Hsbc Bank Usa Na
Purchase Details
Closed on
Nov 4, 2006
Sold by
Gianduso Gary J and Gianduso Najwa
Bought by
Gianduso Gary J and Gianduso Najwa
Create a Home Valuation Report for This Property
The Home Valuation Report is an in-depth analysis detailing your home's value as well as a comparison with similar homes in the area
Home Values in the Area
Average Home Value in this Area
Purchase History
| Date | Buyer | Sale Price | Title Company |
|---|---|---|---|
| Ramirez Ventura Edibulga | -- | Covenant Abstract | |
| Ventura Edibulga Ramirez | $165,000 | None Available | |
| Simet Regino | $35,699 | None Available | |
| Hsbc Bank Usa Na | $3,869 | None Available | |
| Gianduso Gary J | -- | None Available |
Source: Public Records
Mortgage History
| Date | Status | Borrower | Loan Amount |
|---|---|---|---|
| Previous Owner | Ventura Edibulga Ramirez | $162,011 |
Source: Public Records
Tax History
| Year | Tax Paid | Tax Assessment Tax Assessment Total Assessment is a certain percentage of the fair market value that is determined by local assessors to be the total taxable value of land and additions on the property. | Land | Improvement |
|---|---|---|---|---|
| 2026 | $1,797 | $87,500 | $21,400 | $66,100 |
| 2025 | $2,513 | $87,500 | $21,400 | $66,100 |
| 2024 | $2,355 | $87,500 | $21,400 | $66,100 |
| 2023 | $2,201 | $87,500 | $21,400 | $66,100 |
| 2022 | $2,185 | $87,500 | $21,400 | $66,100 |
| 2021 | $2,135 | $87,500 | $21,400 | $66,100 |
| 2020 | $1,907 | $87,500 | $21,400 | $66,100 |
| 2019 | $1,968 | $87,500 | $21,400 | $66,100 |
| 2018 | $1,901 | $87,500 | $21,400 | $66,100 |
| 2017 | $1,752 | $87,500 | $21,400 | $66,100 |
| 2016 | $861 | $87,500 | $21,400 | $66,100 |
| 2015 | $1,869 | $87,500 | $21,400 | $66,100 |
| 2014 | $1,869 | $87,500 | $21,400 | $66,100 |
Source: Public Records
Map
Nearby Homes
- 60 E Jefferson Ave
- 118 E Green St
- 1 W Diamond Ave
- 218 North St
- 239 Lincalis St
- 829 W 21st St
- 328 W Green St
- 403 W 7th St
- 360 W Spruce St
- 897 N Vine St
- 1087 Lafayette Ct
- 187 N Church St
- AV1.022 Sisilla Dr
- 370 Inverness Ln
- EH-391 Birkdale Ct
- TV 202 Buttonbush & White Oak Ln
- 29 J Jahanna Cir
- 49 Creekside Dr
- 12 AV2 Opalanie Dr
- HF4.107 Acorn Dr
- 1029 W 9th St
- 702 Roosevelt St
- 696 Roosevelt St
- 706 Roosevelt St
- 695 Boundary St
- 688 Roosevelt St
- 685 Boundary St
- 1078 W 9th St
- 699 Boundary St
- 709 Boundary St
- 301 N 5th St
- 301 N 5th St
- 309 N 5th St
- 313 N 5th St
- 305 N 5th St
- 1012 W 11th St
- 713 Boundary St
- 1016 W 11th St
- 1020 W 11th St
- 1014 W 11th St
Your Personal Tour Guide
Ask me questions while you tour the home.