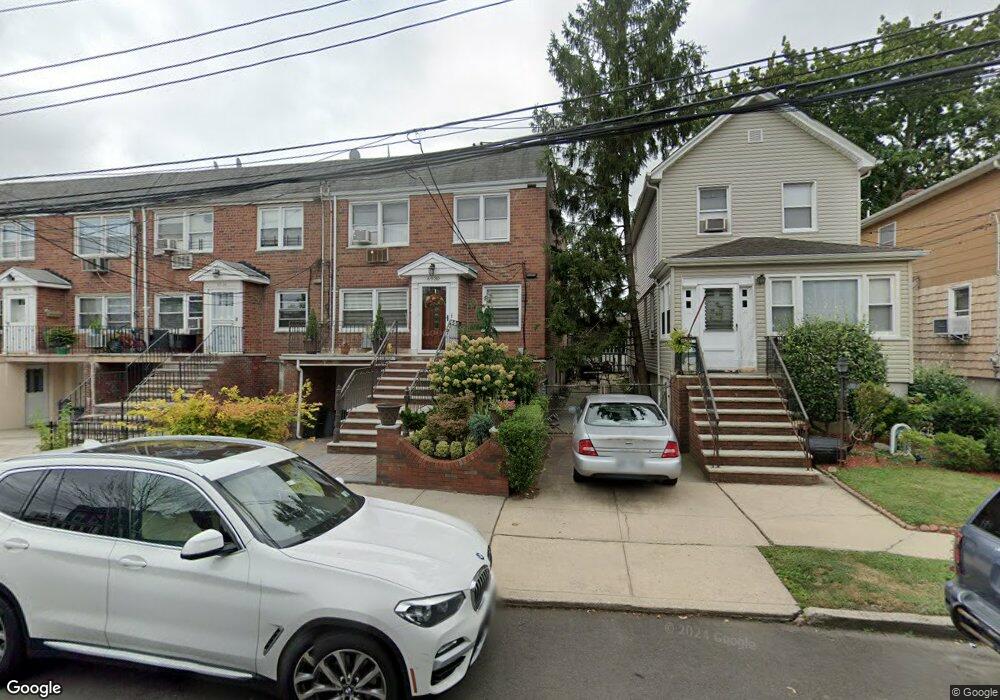
6930 60th Rd Maspeth, NY 11378
Maspeth NeighborhoodEstimated Value: $1,050,305 - $1,205,000
3
Beds
2
Baths
2,000
Sq Ft
$568/Sq Ft
Est. Value
About This Home
This home is located at 6930 60th Rd, Maspeth, NY 11378 and is currently estimated at $1,136,576, approximately $568 per square foot. 6930 60th Rd is a home located in Queens County with nearby schools including Ps 58 School Of Heroes, IS 73 - The Frank Sansivieri School, and Grover Cleveland High School.
Ownership History
Date
Name
Owned For
Owner Type
Purchase Details
Closed on
Apr 19, 2000
Sold by
Valenti Leo
Bought by
Obrien Daniel J
Current Estimated Value
Home Financials for this Owner
Home Financials are based on the most recent Mortgage that was taken out on this home.
Original Mortgage
$217,500
Outstanding Balance
$74,515
Interest Rate
8.23%
Estimated Equity
$1,062,061
Create a Home Valuation Report for This Property
The Home Valuation Report is an in-depth analysis detailing your home's value as well as a comparison with similar homes in the area
Home Values in the Area
Average Home Value in this Area
Purchase History
| Date | Buyer | Sale Price | Title Company |
|---|---|---|---|
| Obrien Daniel J | $290,000 | Pioneer Land Title Corp |
Source: Public Records
Mortgage History
| Date | Status | Borrower | Loan Amount |
|---|---|---|---|
| Open | Obrien Daniel J | $217,500 |
Source: Public Records
Tax History
| Year | Tax Paid | Tax Assessment Tax Assessment Total Assessment is a certain percentage of the fair market value that is determined by local assessors to be the total taxable value of land and additions on the property. | Land | Improvement |
|---|---|---|---|---|
| 2025 | $7,197 | $37,979 | $14,844 | $23,135 |
| 2024 | $7,197 | $35,831 | $14,502 | $21,329 |
| 2023 | $7,168 | $35,686 | $12,321 | $23,365 |
| 2022 | $6,781 | $68,640 | $22,560 | $46,080 |
| 2021 | $6,786 | $61,320 | $22,560 | $38,760 |
| 2020 | $6,699 | $61,860 | $22,560 | $39,300 |
| 2019 | $6,246 | $65,520 | $22,560 | $42,960 |
| 2018 | $6,062 | $29,738 | $11,363 | $18,375 |
| 2017 | $5,770 | $28,305 | $13,557 | $14,748 |
| 2016 | $5,372 | $28,305 | $13,557 | $14,748 |
| 2015 | $3,001 | $26,374 | $16,729 | $9,645 |
| 2014 | $3,001 | $24,883 | $15,855 | $9,028 |
Source: Public Records
Map
Nearby Homes
Your Personal Tour Guide
Ask me questions while you tour the home.