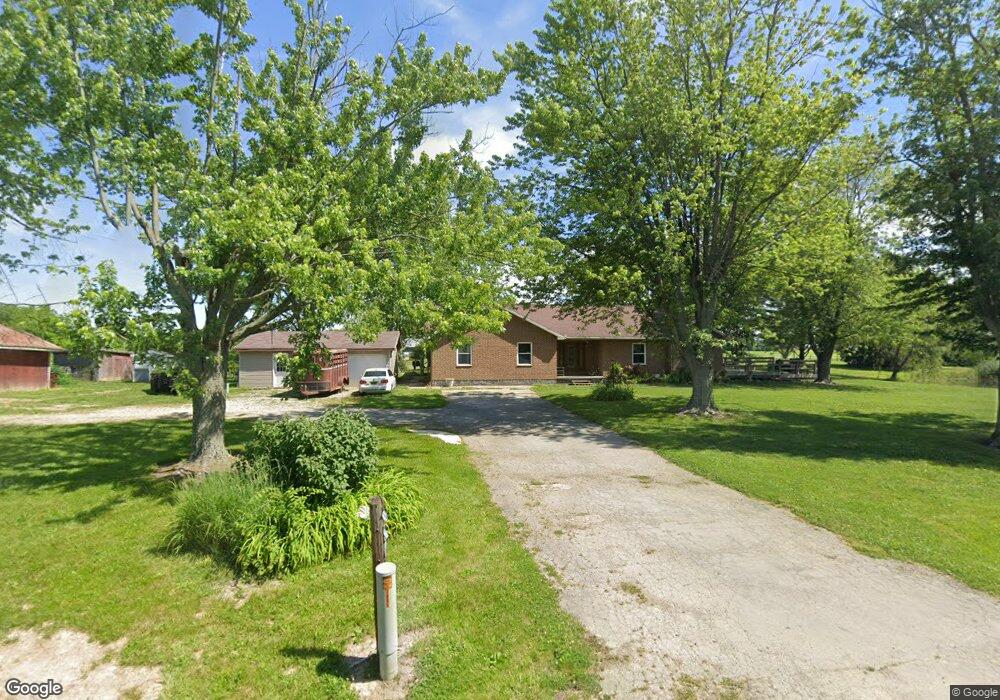
6930 Darke Preble Co Line Rd Arcanum, OH 45304
Estimated Value: $320,000 - $448,000
4
Beds
2
Baths
2,370
Sq Ft
$167/Sq Ft
Est. Value
About This Home
This home is located at 6930 Darke Preble Co Line Rd, Arcanum, OH 45304 and is currently estimated at $396,597, approximately $167 per square foot. 6930 Darke Preble Co Line Rd is a home located in Darke County with nearby schools including Arcanum Elementary School, Butler Middle School, and Arcanum High School.
Ownership History
Date
Name
Owned For
Owner Type
Purchase Details
Closed on
Oct 15, 2020
Sold by
Suggs Jennifer R and Suggs Christopher D
Bought by
Cherico Richard J
Current Estimated Value
Home Financials for this Owner
Home Financials are based on the most recent Mortgage that was taken out on this home.
Original Mortgage
$232,000
Outstanding Balance
$205,975
Interest Rate
2.8%
Mortgage Type
New Conventional
Estimated Equity
$190,622
Purchase Details
Closed on
Jun 9, 2011
Sold by
Weaver Whiting Jennifer R
Bought by
Weaver Whitting Jennifer R and Sugg Christoher D
Purchase Details
Closed on
Jul 2, 2009
Sold by
Whiting Justin D
Bought by
Weaver Whiting Jennifer R
Purchase Details
Closed on
Apr 9, 2002
Sold by
Weaver Michael
Bought by
Whiting Justin and Whiting Jennifer
Home Financials for this Owner
Home Financials are based on the most recent Mortgage that was taken out on this home.
Original Mortgage
$89,400
Interest Rate
6.87%
Mortgage Type
New Conventional
Create a Home Valuation Report for This Property
The Home Valuation Report is an in-depth analysis detailing your home's value as well as a comparison with similar homes in the area
Home Values in the Area
Average Home Value in this Area
Purchase History
| Date | Buyer | Sale Price | Title Company |
|---|---|---|---|
| Cherico Richard J | $290,000 | None Available | |
| Weaver Whitting Jennifer R | -- | Attorney | |
| Weaver Whiting Jennifer R | -- | Attorney | |
| Whiting Justin | $87,300 | -- |
Source: Public Records
Mortgage History
| Date | Status | Borrower | Loan Amount |
|---|---|---|---|
| Open | Cherico Richard J | $232,000 | |
| Previous Owner | Whiting Justin | $89,400 |
Source: Public Records
Tax History Compared to Growth
Tax History
| Year | Tax Paid | Tax Assessment Tax Assessment Total Assessment is a certain percentage of the fair market value that is determined by local assessors to be the total taxable value of land and additions on the property. | Land | Improvement |
|---|---|---|---|---|
| 2024 | $3,451 | $107,320 | $17,720 | $89,600 |
| 2023 | $3,456 | $107,320 | $17,720 | $89,600 |
| 2022 | $3,495 | $98,970 | $15,590 | $83,380 |
| 2021 | $3,996 | $100,290 | $16,910 | $83,380 |
| 2020 | $3,877 | $100,290 | $16,910 | $83,380 |
| 2019 | $3,333 | $86,390 | $16,910 | $69,480 |
| 2018 | $3,821 | $86,390 | $16,910 | $69,480 |
| 2017 | $3,400 | $86,390 | $16,910 | $69,480 |
| 2016 | $3,403 | $81,170 | $13,690 | $67,480 |
| 2015 | $2,947 | $81,170 | $13,690 | $67,480 |
| 2014 | $2,984 | $81,170 | $13,690 | $67,480 |
| 2013 | $2,886 | $74,300 | $13,410 | $60,890 |
Source: Public Records
Map
Nearby Homes
- 6806 Darke-Preble County Line Rd
- 140 State Route 503
- 10995 Rockridge Rd
- 0 Friday Rd
- 610 Pearl St
- 620 Pearl St
- 693 Friday Rd
- 0 Ohio 722 Unit 10051560
- 0 Ohio 722 Unit 10 Acres 1040185
- 0 Ohio 722 Unit 938536
- 0 Ohio 722
- 6254 State Route 722
- 6051 Sonora Rd
- 7163 Georgetown Verona Rd
- 9517 Verona Rd
- 9923 Euphemia Castine Rd
- 5101 Pundt Rd
- 0 E Scott Unit 942470
- 383 Georgetown Verona Rd
- 246 N Main St
- 36 State Route 503
- 12217 State Route 503 N
- 3 St Rt 503
- 5 State Route 503
- 60 State Route 503
- 80 State Route 503
- 4464 Darke-Preble County Line Rd
- 101 State Route 503
- 122 State Route 503
- 4464 Preble Darke County Line Rd
- 6740 Darke Preble County Line Rd
- 159 State Route 503
- 159 State Route 503
- 11844 State Route 503 N
- 11737 State Route 503 N
- 4538 Preble Darke County Line Rd
- 205 State Route 503
- 235 State Route 503
- 240 State Route 503
- 289 State Route 503