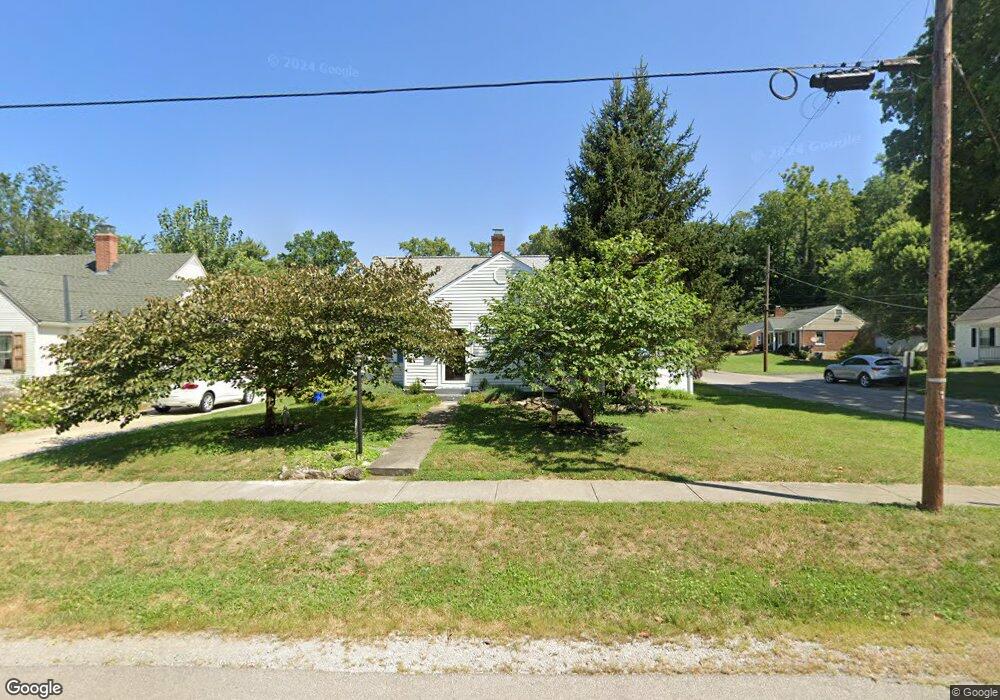
6930 Edith St Cincinnati, OH 45244
Estimated Value: $203,817 - $247,000
3
Beds
1
Bath
1,128
Sq Ft
$201/Sq Ft
Est. Value
About This Home
This home is located at 6930 Edith St, Cincinnati, OH 45244 and is currently estimated at $226,204, approximately $200 per square foot. 6930 Edith St is a home located in Hamilton County with nearby schools including Mercer Elementary School, Nagel Middle School, and Turpin High School.
Ownership History
Date
Name
Owned For
Owner Type
Purchase Details
Closed on
Jun 29, 2007
Sold by
Popplewell Juanita A
Bought by
Jancha Theodore J and Jancha Doris J
Current Estimated Value
Home Financials for this Owner
Home Financials are based on the most recent Mortgage that was taken out on this home.
Original Mortgage
$129,225
Outstanding Balance
$78,901
Interest Rate
6.42%
Mortgage Type
Unknown
Estimated Equity
$147,303
Purchase Details
Closed on
Dec 10, 1999
Sold by
Meade Margaret A and Meade Margaret A
Bought by
Popplewell Juanita A
Home Financials for this Owner
Home Financials are based on the most recent Mortgage that was taken out on this home.
Original Mortgage
$107,800
Interest Rate
8.02%
Purchase Details
Closed on
Jul 26, 1995
Sold by
Delahanty Elise and Cornelius Elise C
Bought by
Meade Margaret A
Home Financials for this Owner
Home Financials are based on the most recent Mortgage that was taken out on this home.
Original Mortgage
$72,000
Interest Rate
7.51%
Create a Home Valuation Report for This Property
The Home Valuation Report is an in-depth analysis detailing your home's value as well as a comparison with similar homes in the area
Home Values in the Area
Average Home Value in this Area
Purchase History
| Date | Buyer | Sale Price | Title Company |
|---|---|---|---|
| Jancha Theodore J | $129,225 | First Title Agency Inc | |
| Popplewell Juanita A | $113,500 | Tri-Star Title Agency Inc | |
| Meade Margaret A | -- | Midland Title Security Inc |
Source: Public Records
Mortgage History
| Date | Status | Borrower | Loan Amount |
|---|---|---|---|
| Open | Jancha Theodore J | $129,225 | |
| Closed | Popplewell Juanita A | $107,800 | |
| Previous Owner | Meade Margaret A | $72,000 |
Source: Public Records
Tax History
| Year | Tax Paid | Tax Assessment Tax Assessment Total Assessment is a certain percentage of the fair market value that is determined by local assessors to be the total taxable value of land and additions on the property. | Land | Improvement |
|---|---|---|---|---|
| 2025 | $2,395 | $52,375 | $9,356 | $43,019 |
| 2023 | $2,412 | $52,375 | $9,356 | $43,019 |
| 2022 | $2,060 | $41,675 | $8,568 | $33,107 |
| 2021 | $1,997 | $41,675 | $8,568 | $33,107 |
| 2020 | $2,033 | $41,675 | $8,568 | $33,107 |
| 2019 | $1,968 | $37,885 | $7,788 | $30,097 |
| 2018 | $1,838 | $37,885 | $7,788 | $30,097 |
| 2017 | $1,738 | $37,885 | $7,788 | $30,097 |
| 2016 | $1,400 | $31,756 | $7,490 | $24,266 |
| 2015 | $1,450 | $31,756 | $7,490 | $24,266 |
| 2014 | $1,452 | $31,756 | $7,490 | $24,266 |
| 2013 | $1,347 | $31,441 | $7,417 | $24,024 |
Source: Public Records
Map
Nearby Homes
- 6912 Edith St
- 6809 Jefferson St
- 3305 Scioto Dr
- 6716 Treeridge Dr
- 2911 Perthwood Dr
- 6362 Stirrup Rd
- 2669 Newtown Rd
- 3420 Oyster Bay Ct
- 2559 Concordgreen Dr
- 7481 Heatherwood Ln
- 7080 Hunley Rd
- 3746 Miami Run
- 3763 Miami Run
- 3767 Miami Run
- 3750 Miami Run
- 3758 Miami Run
- 3771 Miami Run
- 3766 Miami Run
- 3754 Miami Run
- 3762 Miami Run
Your Personal Tour Guide
Ask me questions while you tour the home.